CIVHC’s Colorado County Profiles are now available for all 64 counties, offering a local look at how people access, use, and pay for health care. Built using claims data from the Colorado All Payer Claims Database (CO APCD), the profiles include county-level information on insurance enrollment, health care spending, and health care utilization trends.
Enrollment: Rural Counties Saw Larger Medicaid Declines
Colorado County Profiles include year-over-year enrollment data for commercial and Medicaid coverage spanning from August 2024 to August 2025. Looking at the percentage change between coverage at these two point-in-time dates, we can clearly see that insurance enrollment shifted across Colorado, particularly in Medicaid coverage.
Overall, Colorado experienced a 5% decrease in commercial health insurance enrollment and a 0.3% decrease in Medicaid enrollment from August 2024 to August 2025*. However, statewide trends mask substantial differences between urban and rural communities. Rural counties experienced an 8.1% decline in Medicaid enrollment, while urban counties saw a 0.9% increase. Conversely, commercial coverage grew by 0.7% in rural counties but declined by 5.5% in urban counties. These divergent trends suggest that residents in rural and urban areas are experiencing markedly different shifts in health insurance coverage, with rural communities facing disproportionately large losses in Medicaid enrollment.

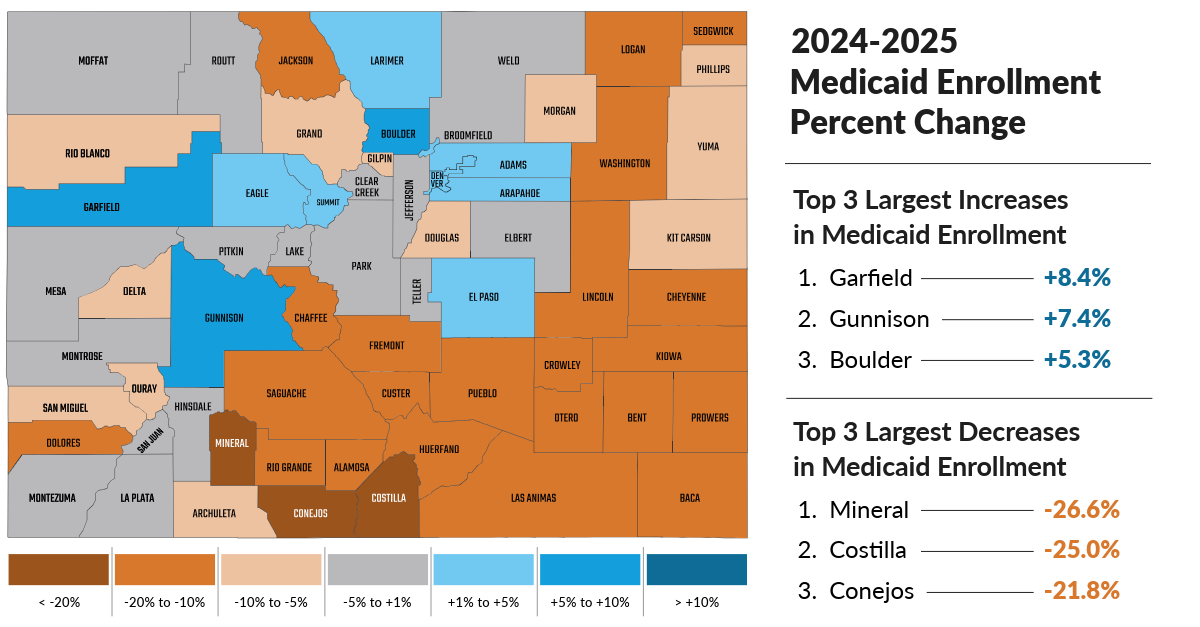
The regional picture adds another layer. Counties in the largely rural Southeast, Northeast, and San Luis Valley regions often saw larger Medicaid enrollment declines. However, this needs some additional context. In smaller counties, a large percentage change may represent a few hundred people, or in a few cases, only a few dozen. Still, the pattern matters. Coverage changes can shape how people access care, when they seek services, and whether they are able to connect with routine preventive care before health needs become more urgent.
Mountain resort counties showed a different kind of enrollment pattern. Counties such as Eagle, Summit Pitkin, and Ouray may have lower rates of people captured in CO APCD data than many other parts of Colorado. This could reflect seasonal employment, transient living arrangements, or enrollment through large self-insured employers, which are not always fully represented in the database.
Together, these findings reinforce that statewide enrollment trends are useful, but they are only a piece of the puzzle. County-level data helps show where coverage changes may be most visible and where more local context is needed.
Utilization Patterns: Primary Care and ED Use Point to Regional Access Pressures
The County Profiles also show how people access care by exploring utilization measures published through CIVHC’s Community Dashboard, including rates of health care users and non-users, preventive breast cancer screening rates, rates of dental care access for children and adolescents, and primary care and emergency department (ED) utilization rates. It is in those last two measures where the most notable patterns emerged.
The counties with the highest ED visit rates were concentrated in the eastern plains (Southeast and Northeast regions) and in the San Luis Valley. These areas are largely rural and include some of Colorado’s lower-population counties, where distance to services, provider availability, transportation, affordability, and other social drivers of health may shape how residents access care.

Notably, many of these counties also saw sizeable Medicaid enrollment declines. All 10 counties with the highest ED visit rates experienced decreases in Medicaid enrollment, with most declines falling between 15% – 20%. The consistency of the pattern suggests that changes in coverage mix may be a piece of the utilization puzzle, but far from the whole story. Looking at primary care access helps to fill in some of the gaps.
Counties with the lowest primary care use were also concentrated in several of these same regions, particularly the Southeast and San Luis Valley, with Alamosa, Las Animas, and Bent counties all appearing on both lists.
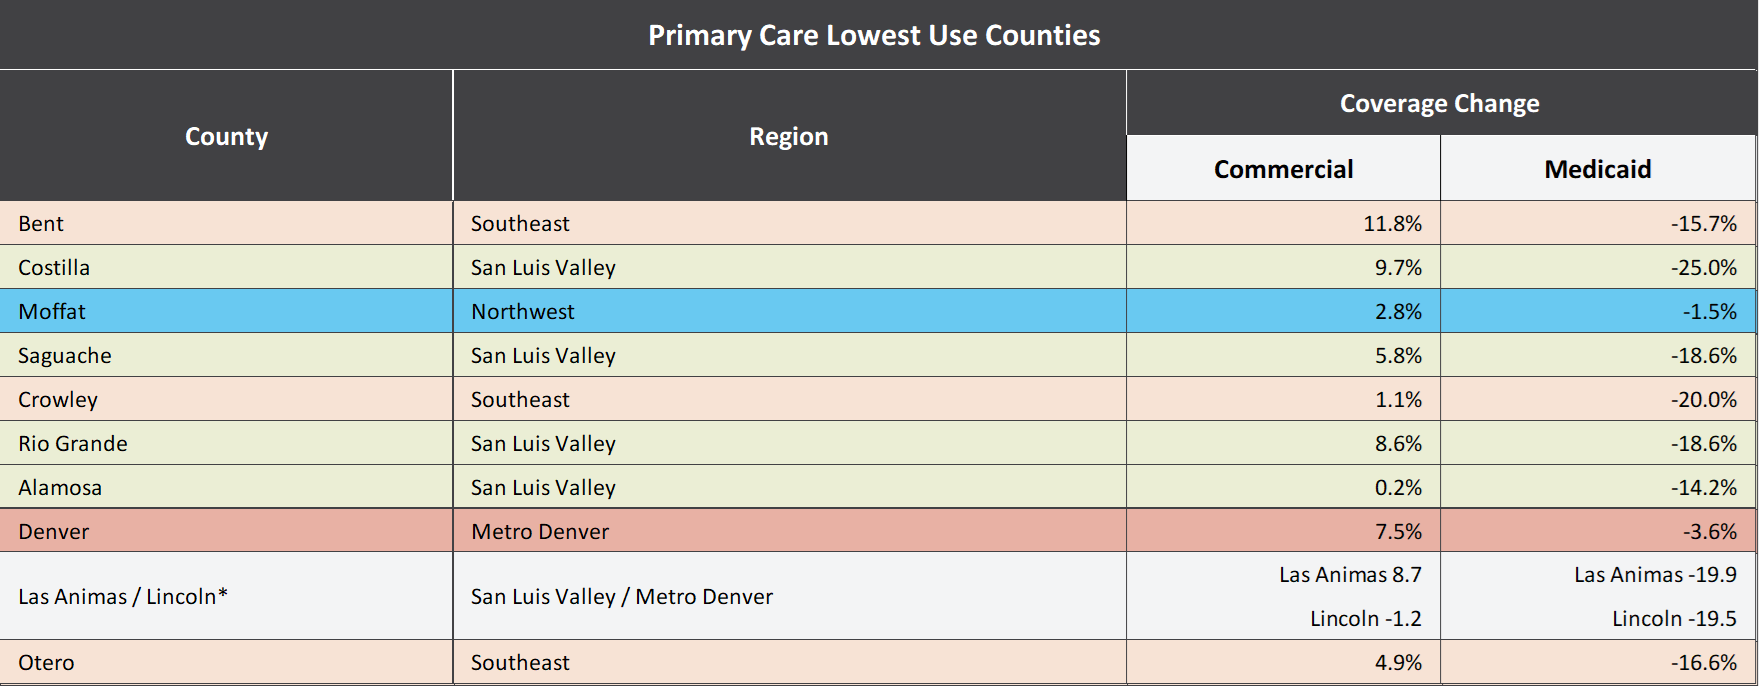
Lower use of primary care and higher ED visit rates may point to places where residents face barriers to routine or preventive care, making the ED a more likely point of access when health needs become urgent.
However, the relationship is not perfectly linear. Some counties with high ED visit rates also appear among counties with higher primary care use. Baca County, for example, appeared at the top of the list both for counties with high ED visit rates and high primary care use.

The counties showing the highest primary care use reflect a mix of rural, mountain, resort, and Front-Range-adjacent areas, showing that higher primary care use can look different through different local contexts. High primary care use may reflect greater health needs, an older or higher-risk population, limited specialty care access, or other local factors. Additionally, in lower-population counties, even modest changes in the number of visits can move rates more dramatically than they would in larger counties. Low use may reflect fewer health needs — or it may reflect barriers to care.
The counties with the lowest ED visit rates add another useful contrast. Many were, again, located in mountain, recreation corridor, Front Range-adjacent, or resort-oriented areas. Some are rural, but their use patterns differ from rural counties in the Eastern Plains and San Luis Valley.

This reinforces a crucial takeaway: “rural” is not a complete explanation for county health care performance or trends. Rural mountain and rural plains counties may have very different health care landscapes, where access to regional hubs, income patterns, insurance mix, seasonal employment, transportation, local provider supply, and more shape how residents access and use care.
This underscores why local data matters: utilization patterns are shaped by more than geography alone. The data point to places where coverage, care availability, and community conditions may be intersecting, but local insight will be essential to understanding what is happening behind the numbers.
Spending on Care Varies Widely by County
The County Profiles also include cost of care measures, showing average spending on health care by patients and health plans combined, per person per year (PPPY).
In 2023, spending varied widely with average spending on care ranging from $7,507 PPPY in El Paso County to $13,302 PPPY in Phillips County.
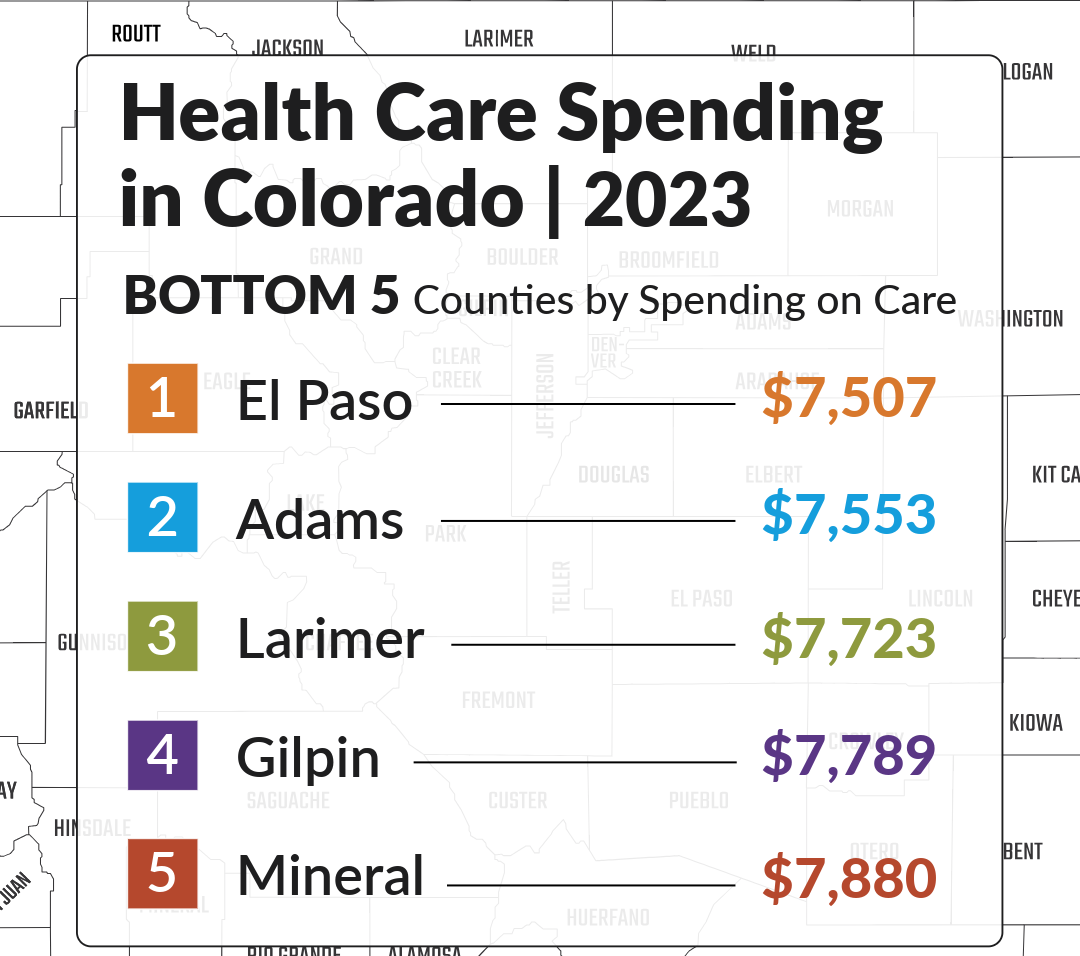

A difference of nearly $5,800 per person between the highest and lowest counties shows why local cost data is so important. Statewide averages can obscure differences that matter to local communities, employers, and policymakers.
Cost data can also help connect the dots with enrollment and utilization. For example, counties with higher spending may not always have higher use, and counties with lower spending may not always be more affordable. A lower spending figure could reflect lower prices or more efficient care. It could also point to less access to services.
Local Data for Local Questions
The Colorado County Profiles show that health care trends are deeply local. Rural counties saw larger Medicaid enrollment declines than urban counties. ED visit rates were highest in parts of the Southeast, Northeast, and San Luis Valley. Counties with lower primary care use often appeared in those same regional clusters. Spending on care varied by thousands of dollars per person across counties.
No single measure tells the full story. Enrollment, utilization, cost, geography, population size, and social drivers of health all interact in ways that look different across Colorado.
By bringing county-level data together in one place, CIVHC aims to help local health care leaders move beyond statewide averages and closer to the communities behind the numbers. The data does not answer every question, but it helps point to the right ones.
Explore your county profile and see how health care trends are showing up close to home.
*Enrollment changes were calculated by comparing county-level enrollment counts from August 2024 and August 2025. These comparisons do not account for other factors that may influence enrollment trends, such as population growth, demographic shifts, or migration.