It was a busy year for the Public Reporting team at the Center for Improving Value in Health Care (CIVHC), which included over 35 publications, such as 13 interactive reports and various analyses aimed at bringing transparency to the health care marketplace. These public releases of data from the Colorado All Payer Claims Database (CO APCD) are widely used in Colorado and nationwide.
Interactive Reports New in 2021-2022
Telehealth vs. In-Person Utilization: This analysis investigates the impact of the COVID-19 pandemic and the subsequent increase in telehealth adoption on overall utilization of high-volume, telehealth-eligible services.
Affordability Dashboard: Launched in early 2022, this brand-new dashboard includes familiar, cost or spending related analyses, updated with current data and revised layouts to improve user experience. The dashboard brings together five key areas:
- Cost of Care: Health care categories that drive the majority of health care spending, including breakouts of high-cost outpatient services
- Low Value Care: Treatments and services that do not improve outcomes for patients, contribute to health care spending, and may cause harm
- Prescription Drug Rebates: Percent of prescription drug spending that comes back to payers in the form of rebates
- Alternative Payment Models: Alternative Payment Models as a percent of total medical payments and primary care payments
- Medicare Reference Based Pricing: What commercial health insurance companies pay hospitals for inpatient and outpatient services as a percent of Medicare
Updated Reports
- Telehealth Service Analysis: The public reporting team updated this cornerstone pandemic analysis that compare telehealth service utilization prior to the onset of COVID-19, during the height of lockdowns, and the months since.
- Shop for Care Tool: This valuable and popular tool empowers Colorado consumers to compare procedure costs for over 53 health care services at over 100 hospitals and facilities across the state.
- Community Dashboard: Incorporating eight new measures in 2022, the Dashboard features data aimed at helping to understand how different aspects of health care – cost, utilization of services, access to care, use of preventive services, and treatment for chronic conditions – vary across Colorado by counties.
- CO APCD Insights Dashboard: Providing an interactive look into the contents of the CO APCD itself, the Insights Dashboard includes information about the percentage of the population represented in each county as well as the number of lives in small group, large group, individual, and employer-based markets.
New Data Bytes
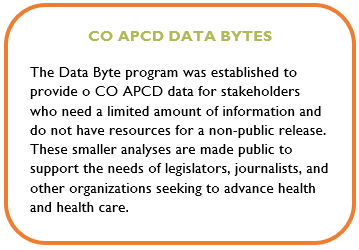
Social Need Codes in the CO APCD: Z Codes became available in 2016 and are a subset of ICD 10 diagnosis codes that identify non-medical factors (such as homelessness or  unemployment) that may influence a patient’s health status. This Data Byte measures the number of claims in the CO APCD with a Z code identifying a health-related social need.
Obstetrics Emergency Department Claims: An analysis showing the frequency of women receiving an additional Emergency Department (ED) charge with a normal labor and delivery.
COVID-19 Testing Price Variation: This data set explores price variation for COVID-19 testing based on where Coloradans received the test in terms of setting (ER, Outpatient facility, or Provider Administered), and by region across the state (DOI and rural vs. urban counties).
Looking Ahead
In the coming year, CIVHC’s Public Reporting team looks forward to providing CO APCD data through a socio-economic lens, enhancing the user experience for our Shop for Care tool, and continuing to provide timely, relevant Data Bytes. We are consistently grateful for the opportunity to use the CO APCD to help increase availability of transparent health care information. The work being done directly advances the original vision of the database as laid out in the enabling legislation and allows everyday Coloradans to make informed decisions about their health.

