Fiscal year 2022-2023 was another busy one for the Public Reporting team at Center for Improving Value in Health Care (CIVHC), which produced over 35 publications including 10 interactive reports and analyses that bring transparency to the health care marketplace. These public releases of data from the Colorado All Payer Claims Database (CO APCD) are widely used both in Colorado and nationwide.
New Interactive Reports in 2022 – 2023
Provider Payment Tool – This new tool, the first of its kind in Colorado, shows how payments to providers vary across the state. This tool includes codes for thousands of services and represents the first comprehensive analysis identifying how much Colorado doctors and other providers get paid.
Health Equity Analysis – CIVHC’s new Health Equity Analysis shows the relationship between key social factors – including income, housing, education, employment, and race/ethnicity/language – and access and use of health care services that can impact a person’s health. This is the first analysis to combine CO APCD data with social and economic information.
- View the analysis
- View the infographic
- Watch the Health Equity Analysis Webinar
Updated Reports
Shop for Care (User Experience upgrades) – This valuable and popular tool empowers Colorado consumers to compare procedure costs for over 53 health care services at over 100 hospitals and facilities across the state. In December 2022, CIVHC enhanced Shop for Care with a mobile-friendly update and also released a version of the report in Spanish.
Telehealth Services Analysis – The public reporting team updated this cornerstone pandemic analysis that compares telehealth service utilization prior to the onset of COVID-19, during the height of lockdowns, and the months since. This year’s update also included a new mental health specific tab that dives deeper into the use of telehealth for mental health services.
Community Dashboard – The Community Dashboard features data aimed at helping to understand how different aspects of health care – cost, utilization of services, access to care, use of preventive services, and treatment for chronic conditions – vary across Colorado by counties. The updated version includes trend information from 2013-2021.
Affordability Dashboard – Launched in early 2022, this dashboard includes analyses that can inform making health care more affordable in Colorado. This year, the dashboard was updated with current data and revised layouts to improve user experience. The dashboard brings together five key areas:
- Cost of Care: Health care categories that drive the majority of health care spending, including breakouts of high-cost outpatient services
- Low Value Care: Treatments and services that do not improve outcomes for patients, contribute to health care spending, and may cause harm
- Prescription Drug Rebates: Percent of prescription drug spending that comes back to payers in the form of rebates
- Alternative Payment Models: Alternative Payment Models as a percent of total medical payments and primary care payments
- Medicare Reference Based Pricing: What commercial health insurance companies pay hospitals for inpatient and outpatient services as a percent of Medicare
CO APCD Insights Dashboard – Providing an interactive look into the contents of the CO APCD itself, the Insights Dashboard includes information about the percentage of the population represented in each county as well as the number of lives in small group, large group, individual, and employer-based markets. The Insights Dashboard shows that the CO APCD now contains over one billion claims!
Emergency Department Use for Mental Health and Self-Harm – First published in 2016 as a Data Byte, this year the Emergency Department Use for Mental Health and Self-Harm was released as an analysis with data through 2021. This custom data set provides a snapshot of utilization, cost and trends for visits to the ED with mental health or potential self-harm as a primary diagnosis, and identified how many of those visits end up in a hospitalization.
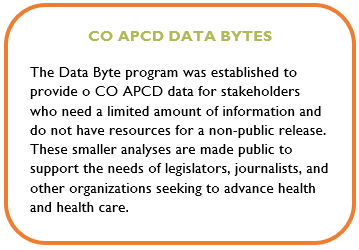
New Data Bytes

Long COVID in Colorado – An analysis identifying the number of Coloradans in the CO APCD who were diagnosed with Long COVID on or after October 1, 2021 (when the ICD-10 long COVID code was implemented).
Vasectomies and Contraception – This Data Byte provides a snapshot of utilization, payer payments and member liability, and trends for vasectomies and oral and non-oral contraception in Colorado from 2018-2021.
COVID-19 Impact on Preventive Care – An analysis measuring trends in the utilization and cost of two preventive care services before and after the onset of the COVID-19 pandemic among Colorado residents. The data provides volume and costs associated with annual wellness and dental visits from 2018 to 2021.
Looking Forward
In the coming year, CIVHC’s Public Reporting team looks forward to continuing to expand on analyses looking at CO APCD data through a socio-economic lens, updating widely used current analyses including Shop for Care and the Community Dashboard, and continuing to provide timely, relevant Data Bytes. We are honored to continue using the CO APCD to increase availability of transparent health care information for Change Agents and help Coloradans make informed decisions about their health care.

