The Center for Improving Value in Health Care (CIVHC) is excited to announce the release of its newly updated Community Dashboard, a powerful and interactive population health report that provides transparent, actionable insights into health care utilization and cost across Colorado.
The update includes some exciting additions to the Community Dashboard, including new, more accessible visualizations. Users will now be able to see their community’s access to dental care for children and adolescents with a new pediatric dental measure, offering insight to services that are essential to the health and well-being of children everywhere. The update also allows users to rank counties by healthcare measures, more clearly illustrating what the state of healthcare is in communities across Colorado.
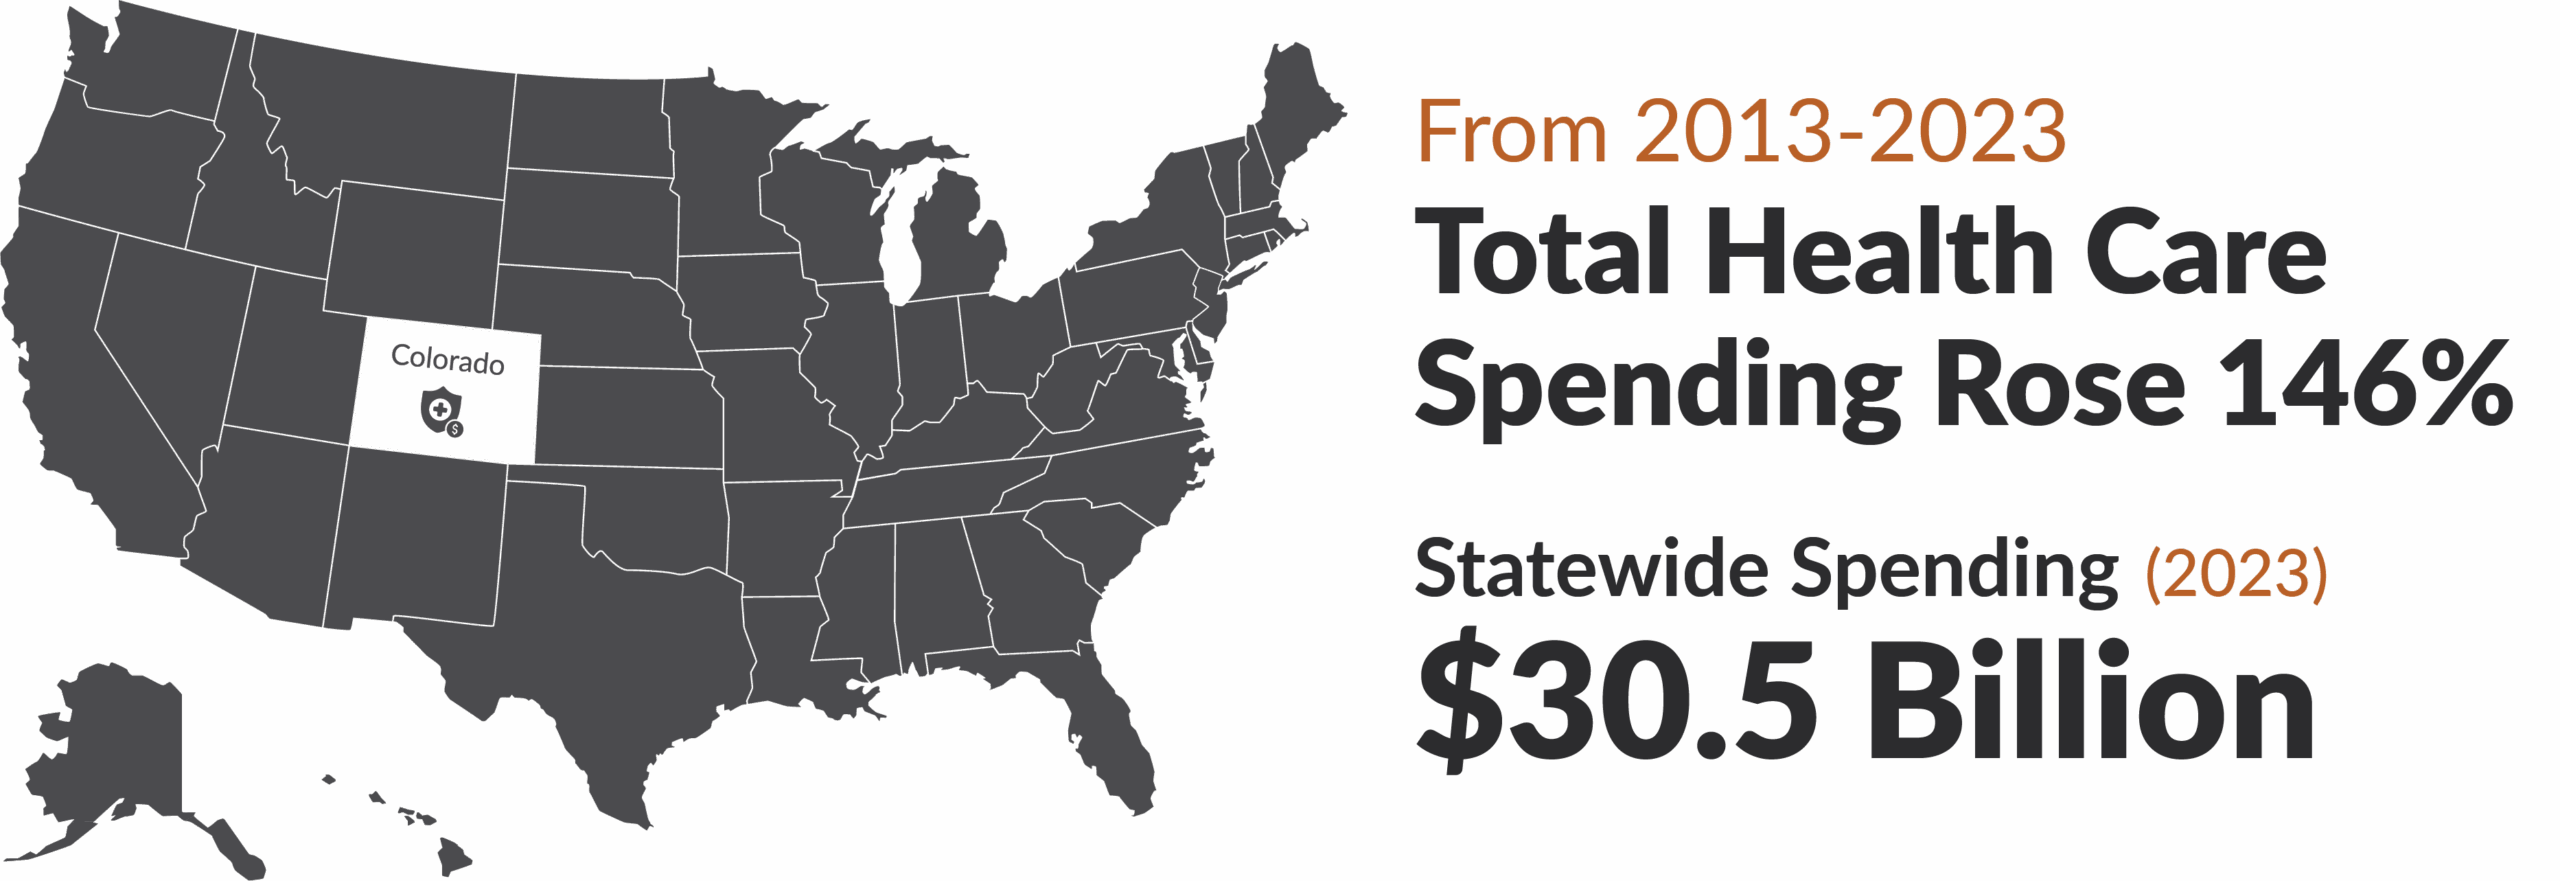
The new analysis shows that between 2013 and 2023, total health care spending across all insurance payers in the Colorado All Payer Claims Database (CO APCD) rose 146% from 2013-2023. Statewide, spending totaled $30.5 billion in 2023.
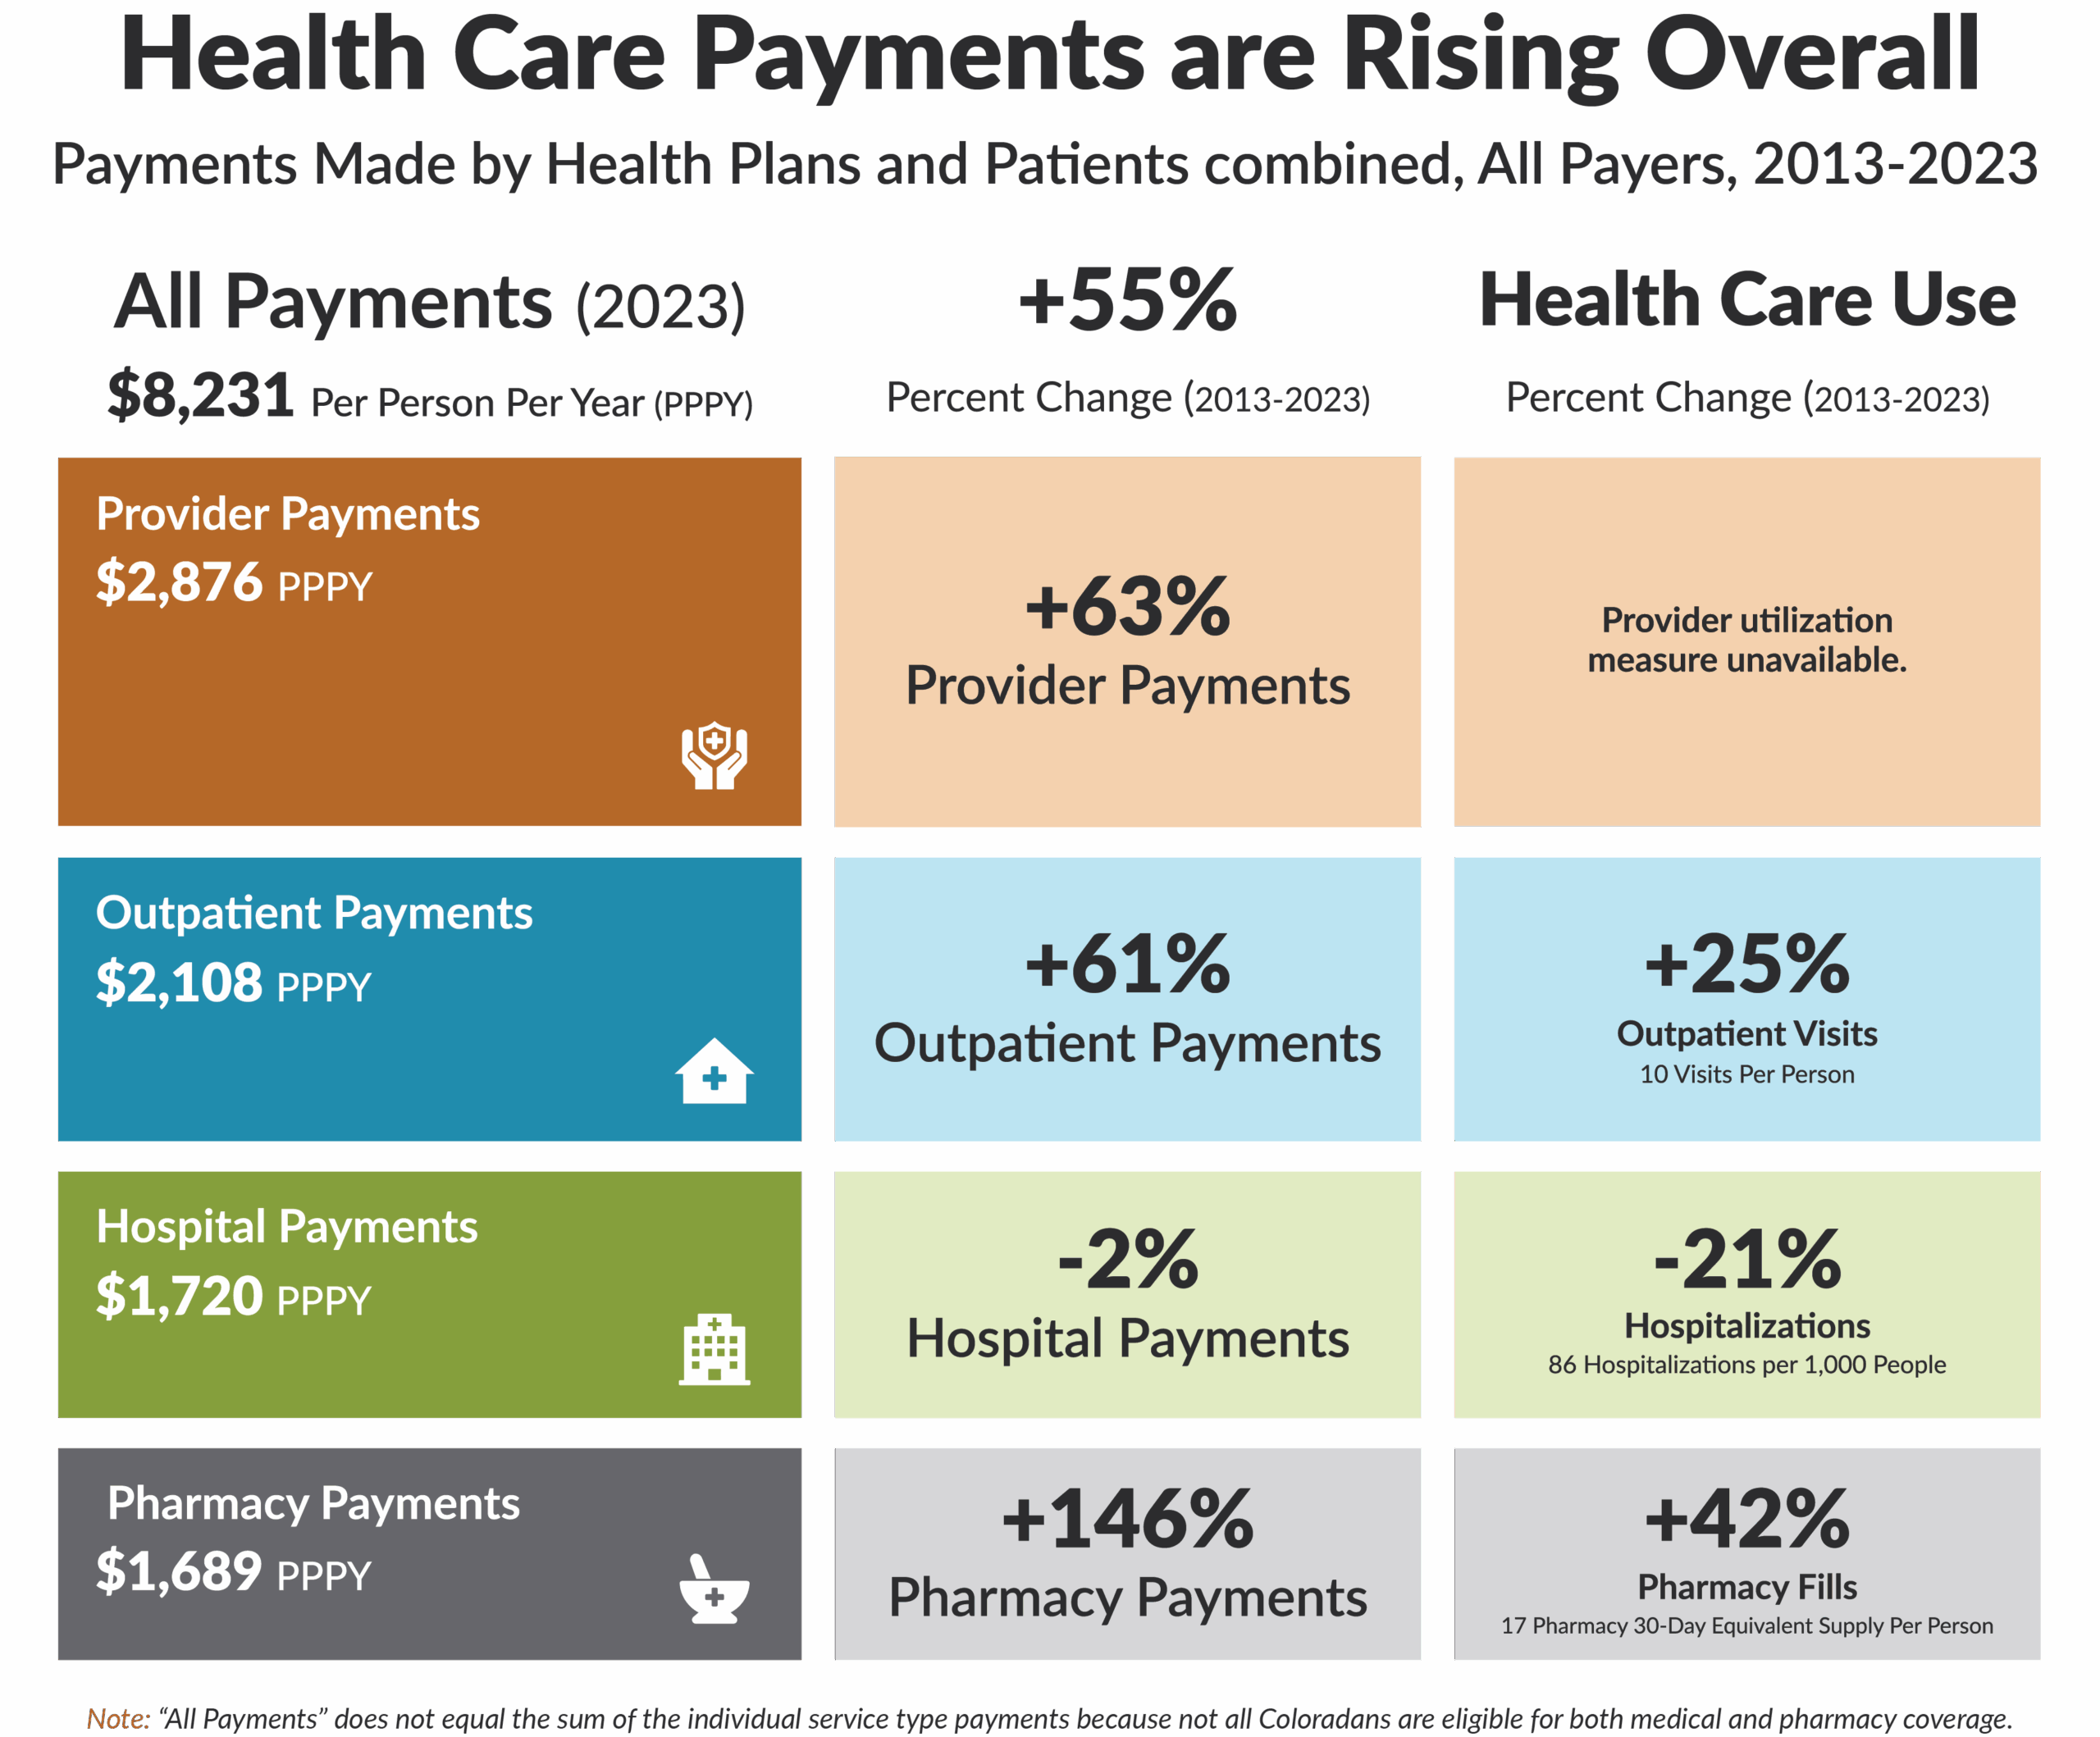
Across service categories, outpatient visits rose by 25%, prescription fills increased by 42%, and inpatient hospitalizations decreased by 21%. In contrast, per person per year (PPPY) costs rose 61% for outpatient care and 146% for prescriptions, while costs for hospitalizations decreased by 2%. This contrast highlights that spending is rising much faster than the actual use of health care services, which indicates that prices for services are driving increases in health care costs, not increased use of services.
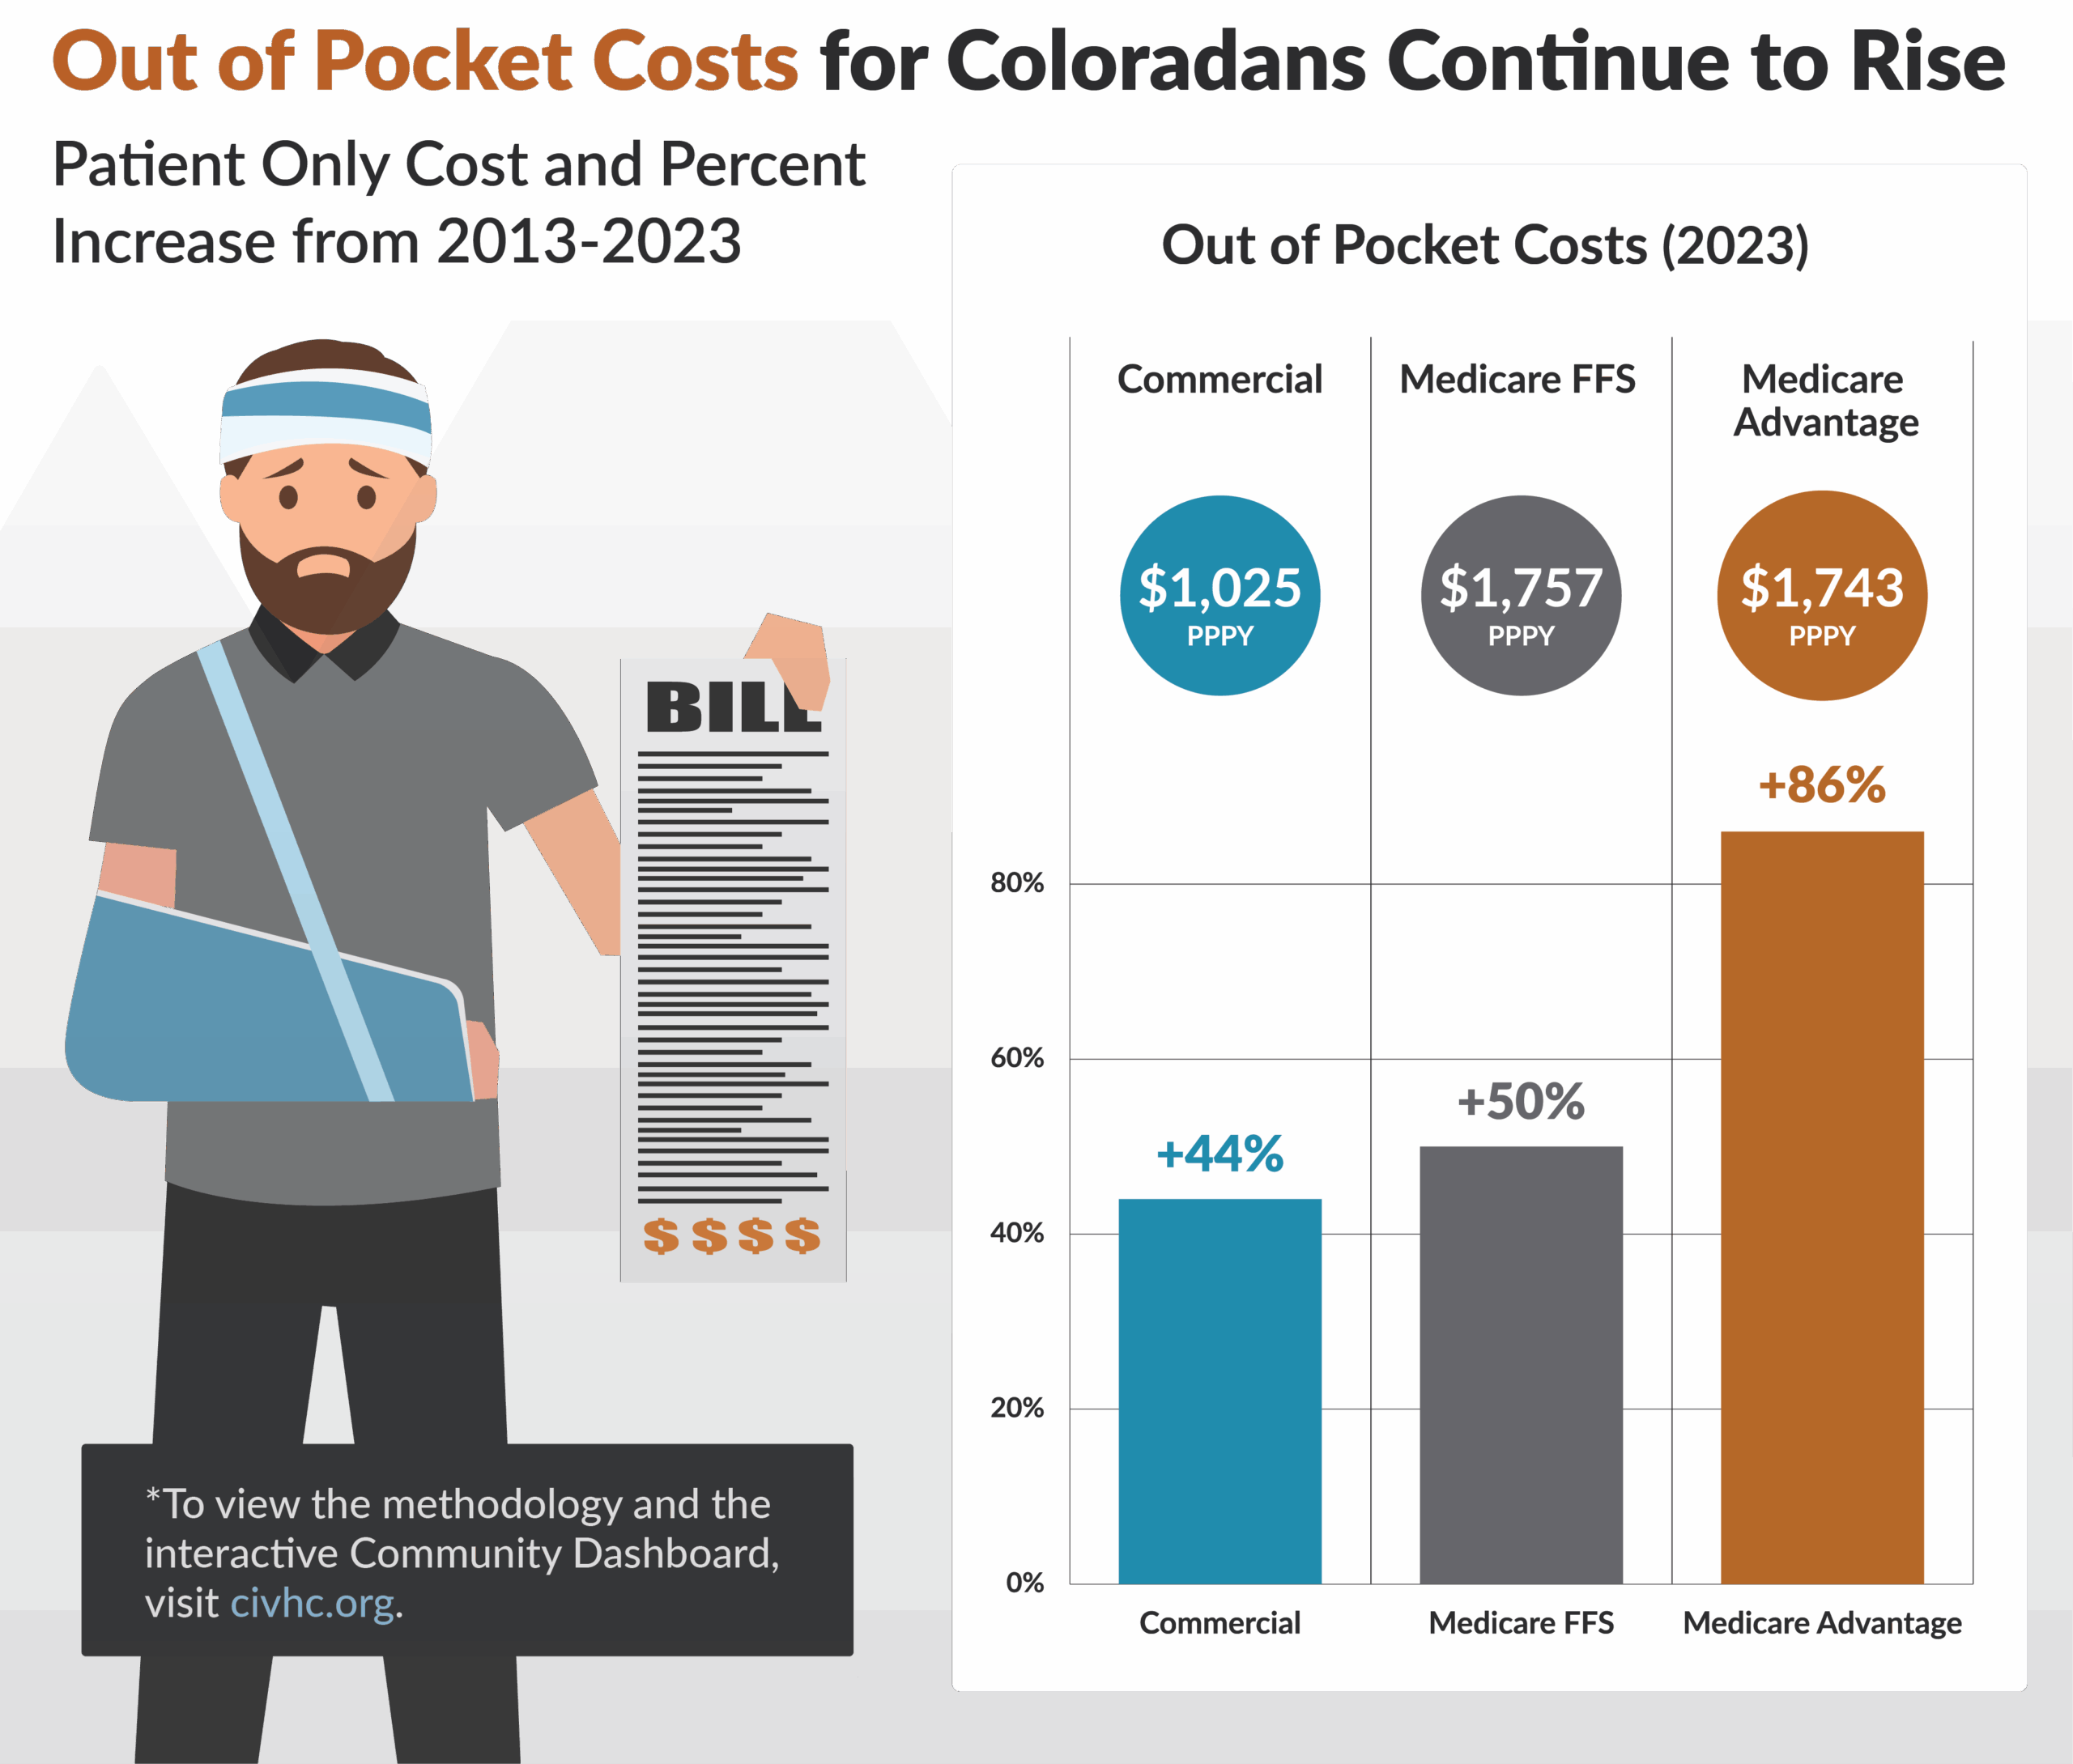
Across the state, out-of-pocket costs for Coloradans with commercial insurance and Medicare Advantage plans rose significantly from 2013-2023. In 2023, Coloradans with commercial insurance paid an average of $1,025 PPPY to access health care services, which is a little over $300 per person jump compared to 2013. In 2023, Coloradans with Medicare Advantage paid an average of $1,743 per person to access health care services, which is over $800 per person jump compared to costs in 2013. These numbers do not include health insurance premiums paid by Coloradans or their employers.
Across all payers and all categories of services in the CO APCD in 2023, payments made by health insurance payers and patients combined totaled $7,860 per person. Digging deeper into spending by health care category shows that payments made directly to doctors and other providers for services was the largest portion of spending (34%), followed by payments for outpatient facilities (26%), prescription drugs (22%), and hospital stays (19%).
“We believe that access to transparent, reliable data is essential to drive meaningful improvements in Colorado’s health care system,” said Kristin Paulson, President and CEO of CIVHC. “The updated Community Dashboard helps Change Agents across the state to make informed decisions that can reduce health care costs, improve access, and address disparities in health outcomes.”
Kristin Paulson, JD, MPH,
This public resource allows community organizations, policymakers, health care providers, and consumers to explore health trends, identify disparities, and inform strategies to improve care and lower costs statewide. The Community Dashboard offers health care data based on demographic factors such as age, gender, and geography, making it an essential tool for advancing health equity. This information answers important questions regarding trends in health care use and spending to help individuals, communities, and organizations focus on areas that impact health care affordability, enabling users to make data-driven decisions that improve outcomes.
CIVHC updates the Community Dashboard annually and seeks input from communities and other Change Agents during the development process. If you have a particular measure of interest for your work that is not currently available, please let us know at info@civhc.org, and we will evaluate including it in future dashboard iterations.
- View the Community Dashboard & Methodology
- Download Excel files with additional data breakouts by age and sex
- View the Annual Check-up Health Care Cost and Use Infographic


