New interactive dashboard provides insights into dental care utilization, costs, and disparities across Colorado
The Center for Improving Value in Health Care (CIVHC), in collaboration with the Colorado Dental Association (CDA), has released the first dental health analysis based on data from the Colorado All Payer Claims Database (CO APCD). The new interactive dashboard is now available at civhc.org and provides a comprehensive look at dental service use, spending trends, and disparities statewide.
Drawing on three years (2022 – 2024) of claims data from commercial payers, the dashboard reveals cost patterns in preventive care, restorative treatments and oral surgery, as well as utilization variations by payer type, region, and demographics.
Among the key findings:
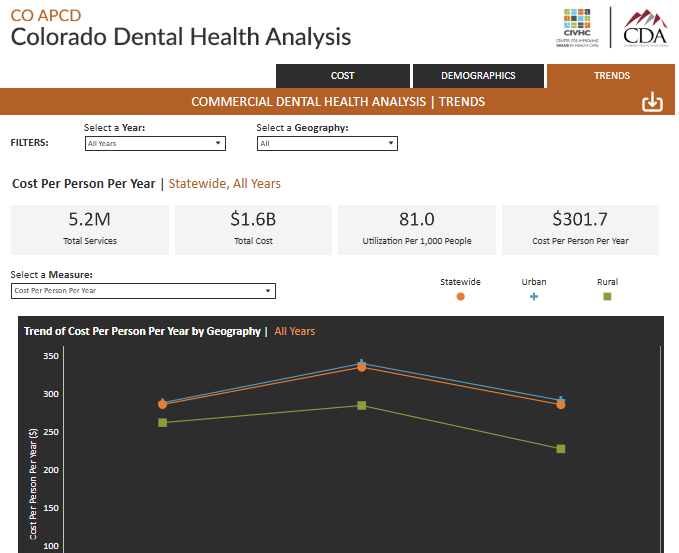
- Utilization of dental services varies across the state, with some rural regions showing lower rates of utilization than urban areas. In 2024, the statewide average utilization rate was 81 per 1,000 people. However, males living in rural areas accessed dental care at a rate of just 59 per 1,000. Younger people in rural areas accessed care at an even lower rate with just 42 per 1,000 receiving dental care.
- High-cost restorative procedures, such as dental implants and prosthetics, contribute significantly to overall spending and reflect the complexity of advanced dental care. CDT (Current Dental Terminology) codes show high use of D6010 (implant placement) across all cross measures, indicating widespread use, while D6113 (implant-supported denture) and D6066 (implant supported porcelain crown) also show high allowed amounts, suggested growing reliance on these complex procedures.
- Costs are higher in many rural regions, where fewer providers and longer travel distances may limit timely care. Among complex treatments, D2740 (porcelain crown) costs 6% more per procedure in rural regions, while D3310 (root canal) averages $620 per service in rural areas compared to $582 in urban ones.
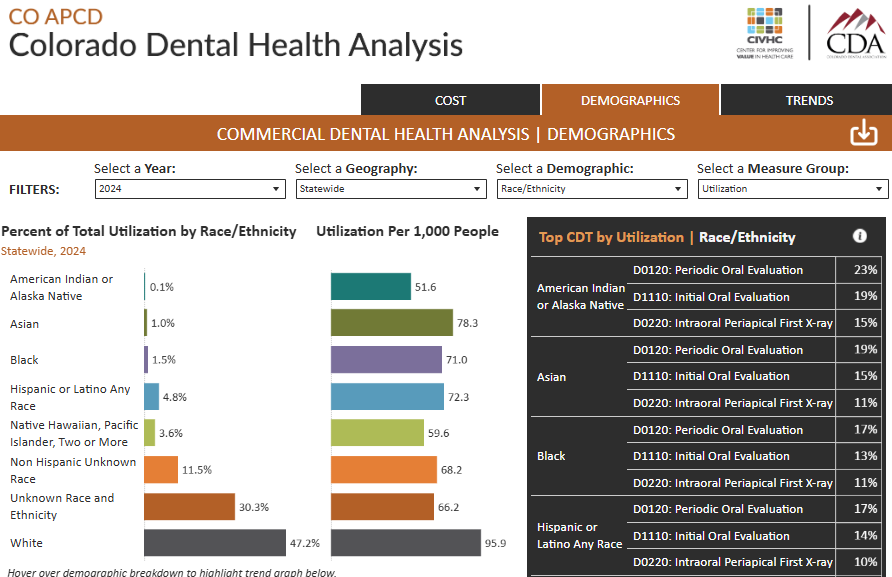
- Utilization rates also vary across demographic groups, with lower care rates observed in younger adults and certain racial and ethnic populations.
“We are excited to work with the data experts at CIVHC to compile and analyze existing state data to increase transparency and improve our understanding of dental care utilization and demographic trends,” said Molly Pereira, Colorado Dental Association Executive Director and CEO. “This resource will help inform oral health policy and drive legislative advocacy that reduces barriers to care and supports meaningful access to dental treatment for Coloradans.”
Understanding Disparities
The analysis underscores a consistent rural-urban divide in access and cost of dental services. Higher costs in rural areas, combined with lower rates of visits, point to potential access challenges. Demographic disparities, such as lower use rates among some racial and ethnic groups – particularly Coloradans who identify as American Indian or Alaska Native and Native Hawaiian or Pacific Islander – raise important questions about affordability, availability, and cultural responsiveness in delivery of dental care.
By making these patterns visible, the dashboard equips health care leaders, community programs, and providers with actionable information to design interventions tailored to the needs of their communities.
A Tool for Action
The dashboard offers practical applications for a variety of audiences:
- Dental and medical providers can identify gaps in preventive care, engage underserved patients, and use insights to support integrated care
- Policy leaders can evaluate trends to uncover access gaps and support broader oral health efforts
- Insurers and care organizations can identify opportunities to align benefits and provider networks to improve oral health outcomes
For providers in particular, the dashboard can highlight trends in patient populations and uncover patterns that may otherwise remain hidden in day-to-day practice. By understanding how utilization and costs differ by geography, payer, or demographic group, providers can adapt care models to focus on prevention, engagement, and early intervention.
The dashboard and a summary of the findings are now available at civhc.org. For more information or additional questions, contact us at info@civhc.org.