A new and enhanced Community Dashboard from the Center for Improving Value in Health Care (CIVHC) provides county and regional information to help communities identify opportunities to improve cost of care, quality, and access and utilization of services. Statewide, results show that in spite of positive decreases in utilization of high cost services and improvements in the quality of care being provided, health care costs continue to rise for Coloradans.
The dashboard contains 2013-2020 data from the Colorado All Payer Claims Database (CO APCD), and helps users identify variation across several critical health care performance measures such as cost trends by payer type, use of preventive screenings for cancers, and potentially avoidable high cost services, thus revealing opportunities that offer the most significant potential for impact across Colorado communities.
Eight measures are new this year and focus on mental health, pediatric care, and avoidable high cost care:
Mental Health-Related Emergency Department Visits
- Follow Up Within 7 Days
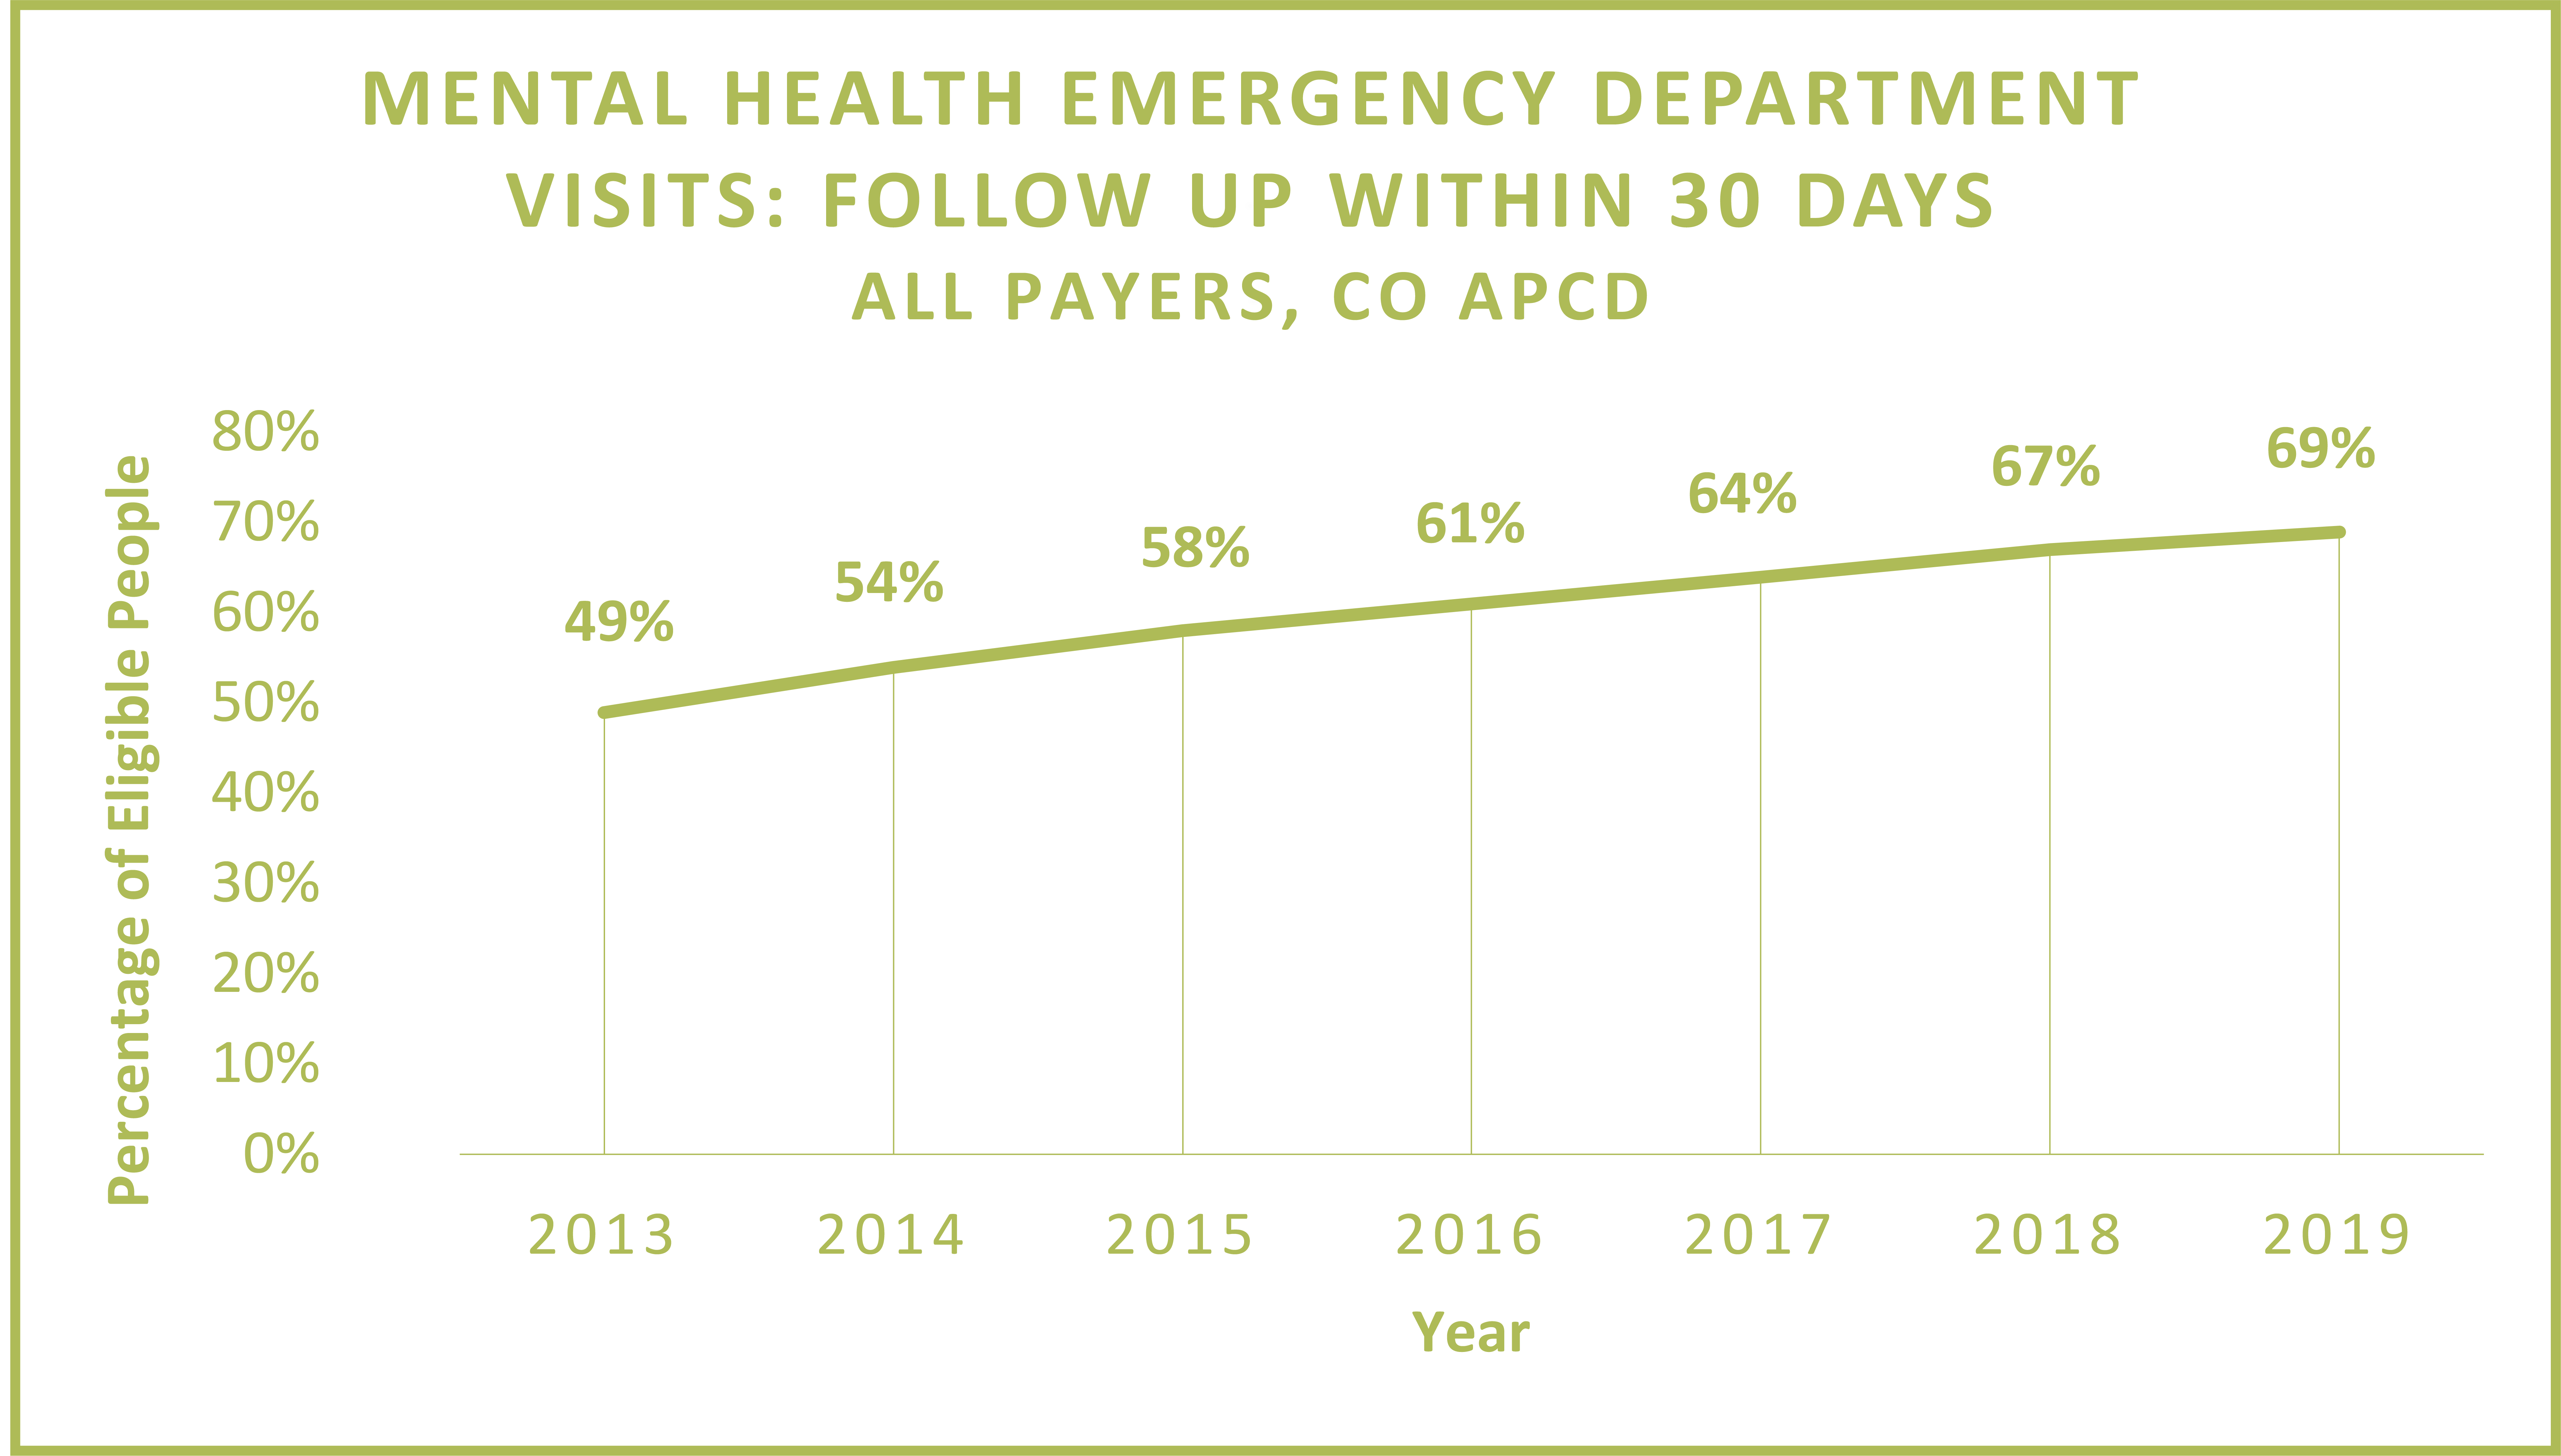
- Follow Up Within 30 Days
Well-Child/Adolescent Visits
- First 15 Months, Six or More Visits
- 16 to 30 Months, Two or More Visits
- Well-Care Visits for Children and Adolescents
Potentially Avoidable High Cost Care
- Emergency Department Visits: Potentially Preventable
- Hospital Admissions: Potentially Preventable
- Hospital 30-Day Readmissions
The data shows several key trends across the new measures when viewing the results across all payers:
- In 2019, over half of all patients who went to the ED for a mental health-related visit had a follow-up visit for mental health within 7 days.

- Additionally, the percentage of patients who had a follow-up visit within 30 days increased by 41% from 2013 to 2019.
- From 2013 to 2019, there was a 34% increase in well-child visits (6 or more visits) for children 15 months or younger.
- Nearly half (46%) of patients ages 3 to 21 had at least one comprehensive well-care visit with a primary care provider or an OB/GYN practitioner in 2019.
- Potentially preventable hospital visits dropped by 31% from 2013 to 2019, and preventable ED visits dropped by 7%.
- Hospital readmissions within 30 days decreased by 25% from 2013 to 2019.
Cost information in the dashboard shows that the cost to provide health care services per person per year (PPPY) in the state continues to increase steadily, with costs for patients and health insurance payers combined increasing 32% from 2013 to 2019. When digging deeper into cost by service category (Inpatient, Outpatient, Professional and Pharmacy), costs PPPY increased the most for prescription drugs (87% increase) followed by outpatient services (42% increase).

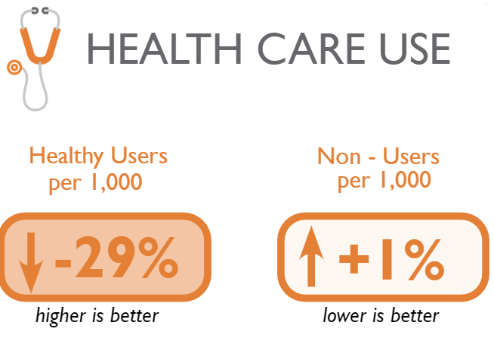
In addition to cost, quality and utilization, measures are also available to help communities understand whether people with insurance are using it for preventive services. The data shows a 29% decrease in healthy users which indicates that insured Coloradans are increasingly not utilizing the health care system in ways that can help them maintain good health. Meanwhile, the percentage of health care “non-users” – people who aren’t using their health insurance at all, regardless of their health status – went up 1%, indicating that some people may be missing opportunities to stay healthy through preventive services.
Additional notable insights show positive trends from 2013-2019 for quality of care, a focus for many providers and health systems across the state for decades, including:
- Screenings for cervical cancer increased by 23%.
- Providing appropriate care for diabetes patients (HBA1c testing) increased by 9%.
- In 2019, 64% of women 50 to 74 years old had breast cancer screening as recommended.
Over time, CIVHC plans to update the Community Dashboard with additional measures and years of data. If you have a particular measure of interest for your work or your community that is not currently available, please let us know at info@civhc.org, and we will evaluate including it in future dashboard iterations which are updated annually.
- View the Community Dashboard & Methodology
- Download the Statewide Overall Trends and Year Over Year Infographics
- Download Excel files with additional data breakouts by age and gender