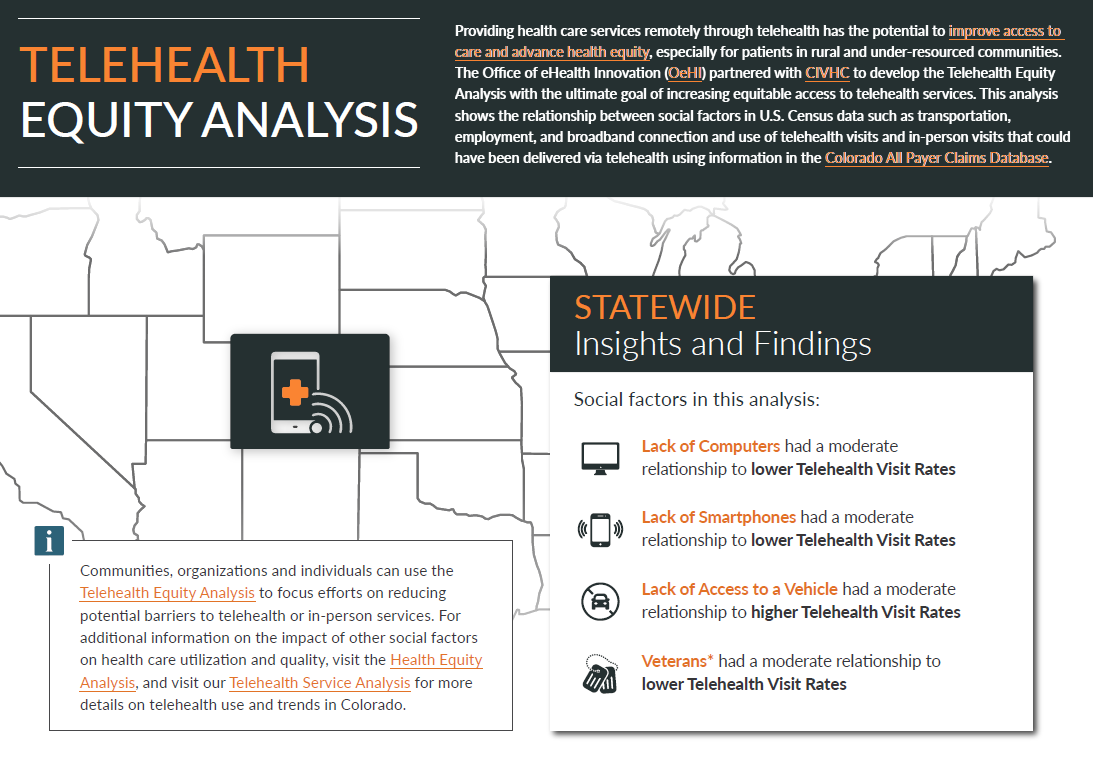
Telehealth Equity Analysis
Providing health care services remotely through telehealth has the potential to improve access to care and advance health equity, especially for patients in rural and under-resourced communities. The Office of e-Health Innovation (OeHI) partnered with CIVHC to develop the Telehealth Equity Analysis with the ultimate goal of increasing equitable access to telehealth services. This analysis shows the relationship between social factors in U.S. Census data such as transportation, employment, and broadband connection and use of telehealth visits and in-person visits that could have been delivered via telehealth using information in the Colorado All Payer Claims Database. This analysis uses claims with a service date between January 1, 2021 to December 31, 2022.
Communities, organizations and individuals can use the Telehealth Equity Analysis to focus efforts on reducing potential barriers to telehealth or in-person services. For additional information on the impact of other social factors on health care utilization and quality, visit the Health Equity Analysis, and visit our Telehealth Service Analysis for more details on telehealth use and trends in Colorado.
Learn More
- Understand how telehealth and in-person visits differ across the state and by county and neighborhood.
- Investigate which social factors have a relationship to high or low use of in-person or telehealth services for your community.
- Develop programs or initiatives to support increased access to telehealth or in-person services, specifically addressing social factors impacting your community
The first tab (map and table view), allows you to select a geography (statewide or an individual county), and service category or social factor of choice. By hovering over the map, you will see all the available data for that area, and by scrolling below the map, you will see a table view of all of the data that can be filtered from high to low or vice versa.
The second tab (relationship view), shows the relationship (if any) between individual social factors and both in-person and telehealth use. Each dot on the graphs represents a community (or census tract).
- The line corresponds to the “R” value, or correlation coefficient, which identifies the strength of the relationship between the social factor and the in-person or telehealth visit rate.
- R values can be interpreted using the following scale:
- Weak or no relationship = 0 to .19
- Moderate relationship = .20 to .39
- Strong relationship = .40 to .69
- Very strong relationship = .70 to 1.0
- Positive R values indicate that the two variables move in the same direction (i.e. when one goes up, the other goes up).
- Negative R values indicate that the two variables move in opposite directions (i.e. when one goes up, the other goes down).
For example, when selecting “Denver County” and “% Without Vehicle”:
- The Telehealth visit R value = 0.41, indicating a strong positive relationship. This indicates that as the percent of people in Denver without a vehicle increases, telehealth visits may also increase.
- The In-Person visit R value = -0.05, indicating a weak, or no relationship between the two. This indicates that regardless of whether fewer or more Denver residents are without a vehicle, in-person visits would likely remain the same.
*Note: In-Person services were limited to ONLY services that COULD have been performed via telehealth and do not include things like surgery or lab tests that require and in-person visit. Review the Methodology document for more information.
- The claims data in this analysis includes all public and private health insurance payers submitting data to the CO APCD, which represents the majority of covered lives (70% of medically insured) in the state. The CO APCD does not include roughly half of the self-insured employer covered lives and does not include federal programs such as Tricare, Indian Health Services and the VA.
- Maps displayed in the report use the 2020 Census tract definitions. See methodology for more information.
- There are multiple factors that can impact a person’s ability to access services via telehealth including availability of telehealth providers in their area and/or network, personal preference and comfort level seeing a provider via telehealth, and more. To fully understand what’s driving telehealth rates, communities need to evaluate telehealth accessibility and community member preferences and barriers.
- Additionally, counties with smaller populations with fewer than 30 census tracts will not have statistically significant correlation data and therefore must use caution when viewing the relationship data.
