A new interactive Community Dashboard from Center for Improving Value in Health Care (CIVHC), provides county and regional information to help communities understand opportunities to improve cost of care, quality, access and utilization of services. Statewide results indicate that between 2013 and 2018, quality of care has improved across several measures, but cost of care is still on the rise, and Coloradans are not always using their health insurance to access important preventive services.
The Community Dashboard, based on 2013-2019 data from the Colorado All Payer Claims Database (CO APCD), is the first of its kind. With information accessible in one report, users can identify variation across a number of important health care performance indicators, enabling them to focus on opportunities that offer the biggest potential impact on their community.
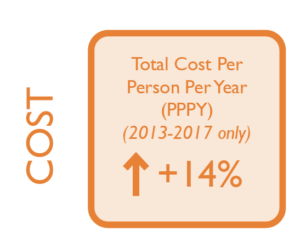
 Risk-adjusted cost information is available for the first time, offering more comparable views of spending across the state’s varied geographies and differing patient populations. Cost can be viewed by health insurance payer type, by health insurance only payments, and patient only payments, and include breakouts of hospital and outpatient facilities, provider and prescription drug payments. The data shows that risk-adjusted per person per year spending increased 14% across Medicaid, Medicare (Fee-for-Service and Advantage), and commercial payers from 2013 to 2017.
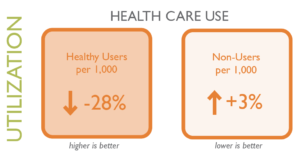
Also new in this dashboard is the ability to understand whether or not Coloradans are utilizing their health insurance. This dashboard describes the percentage of health care “Non-Users”, defined as people who aren’t using their health insurance at all, regardless of their health condition. The percentage of “Non-Users” went up 3% during 2013 to 2018, which is an indication that Coloradans are potentially missing opportunities to prevent serious illness. The new dashboard also describes the percentage of “Healthy Users”, or Coloradans with insurance who don’t have chronic health conditions, and use health care for preventive visits or acute minor conditions. The percentage of “Healthy Users” decreased by 24% between 2013 and 2018, also indicating that healthy people aren’t always utilizing the health care system in ways that can help them remain in good health.
“Cost of care has been proven to have an impact on people being able to purchase insurance and subsequently using their insurance,” stated Ana English, President and CEO of CIVHC. “This new data shows costs continue to rise, and utilization of health care services for preventive care and mild conditions is decreasing. This is in spite of free preventive care as a result of the Affordable Care Act and could have a negative impact on the health of Coloradans long-term.”
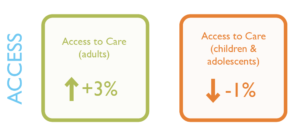
When it comes to Coloradans having adequate access to care, this dashboard also includes two new measures: Access to preventive or ambulatory care for adults and access to primary care for children and adolescents. From 2013-2018, there was a slight increase (3%) in adult access to ambulatory services and a slight decrease (1%) in access to primary care for children and adolescents. For children in particular, it is important to maintain regular access to high-quality primary care services, since it has been found to significantly reduce children’s non-urgent Emergency Room (ER) visits. ER visits across all Coloradans, regardless of age, increased by 5% across all payers.
Quality of care, a focus for many providers and health systems across the state for decades, showed positive trends. Most notably, screenings for cervical cancer increased 19% during the study period for all payers across the state. Breast cancer screening also increased by 9%, and providing appropriate care for diabetes patients (HBA1c) also increased by 8%.
Over time, CIVHC plans to update the Community Dashboard with additional measures and years of data. If you have a particular measure of interest for your work or your community that is not available currently, please let us know at info@civhc.org, and we will consider it for future dashboard iterations.
- View the Community Dashboard
- Download the Statewide Insights Infographic
- Contact us to receive downloadable Excel files with additional data breakouts by age and gender


