CO APCD Insights Dashboard
Curious about what’s in the Colorado All Payer Claims Database (CO APCD)?
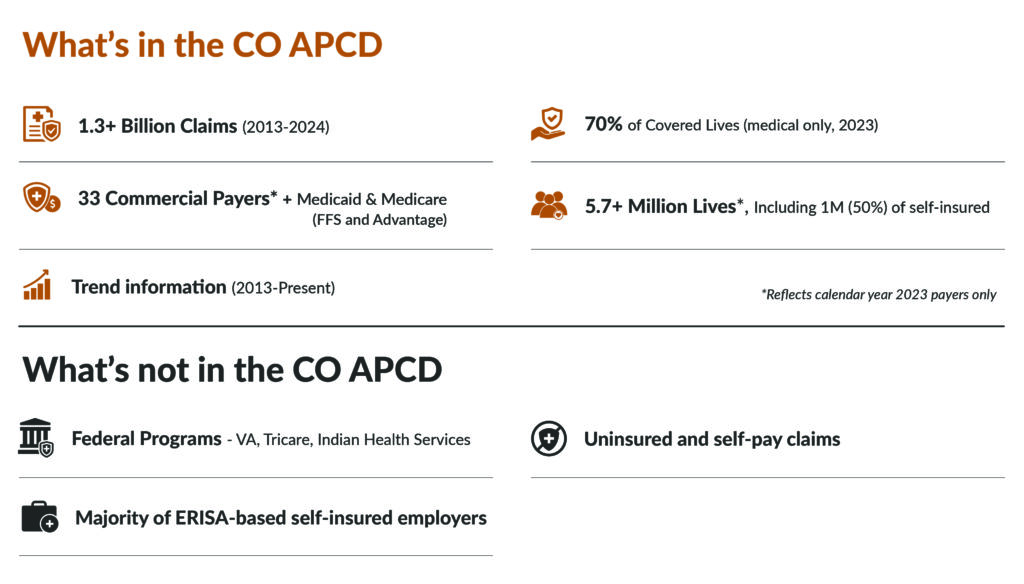
This interactive dashboard lets you explore how many claims and people are represented in the CO APCD—and how that varies over time by claim type (medical, dental, pharmacy), payer type, and year. You can dive into trends, view the percent of Colorado’s population represented in the database, and much more.
The report highlights several key areas, including:
- Trends across behavioral health, dental, vision, inpatient, outpatient, and professional claims
- Covered lives broken down by employer group size and county
- Demographic data including race/ethnicity, sex, and age
Have suggestions or questions?
We’d love to hear from you. Reach out to us at info@civhc.org.

Key Considerations:
- Complete claims for Medicare FFS are available for medical claims through December 2024, and for pharmacy claims through December 2023.
For 2023, some medical and pharmacy claims data are available from supplemental plans, however, it is important to note when viewing Medicare FFS data and all payer data, complete claims for Medicare FFS are not represented. - Estimates of the population represented in the CO APCD are based on comparisons with U.S. Census Bureau data, which includes people covered by federal insurance programs like the VA, TRICARE, and Indian Health Services—plans that are not included in the CO APCD.
- In the CO APCD Overview section, the counts reflect the number of unique insured individuals who had any matching payer and coverage type during at least one month within the selected year(s).
-
On the Population section, only individuals with medical coverage in December of each year are included in the counts. People with only dental or pharmacy coverage, or those who didn’t have coverage in December, are excluded. This “point-in-time” method was used to better match ACS Census data, which serves as the denominator for population percentage estimates.See methodology for more details.