It is estimated that 80% of a person’s health outcomes are related to social factors outside of their control. These social determinants of health are the nonmedical factors that influence a person’s health, including the conditions in which they are born, live, work, and age. In 2021, CIVHC took a big step to enhance the CO APCD and its capacity to report on these social conditions by geocoding the database. The CO APCD can now provide deeper, more insightful analyses into how these social determinants of health affect access to health care across the state and is one of the few APCDs in the country with this capability.
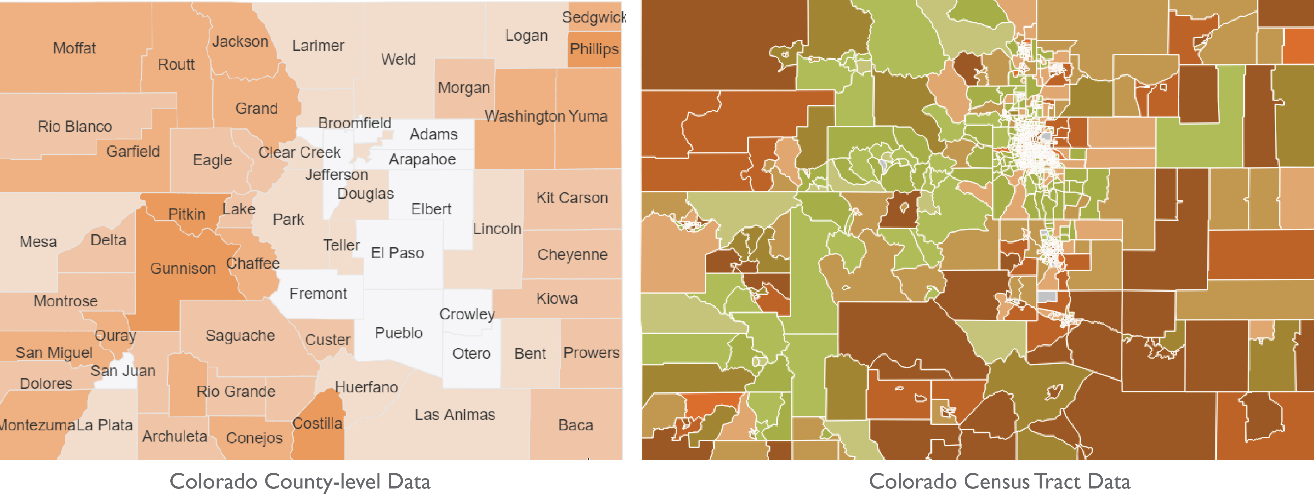
Geocoding is the process of tagging each person represented in the CO APCD with latitude and longitude coordinates. This allows CIVHC analysts to link member and provider addresses to data sources at different geography levels, including the census tract level. While the CO APCD can report data at county and zip code levels, linking data at the census tract level significantly increases the specificity of the CO APCD. At the census tract level, data is broken into small “neighborhoods” comprising an average of 4,000 people, and no more than 8,000, allowing for heightened insights and precise geographic analysis.
Geocoding also opens the door to linking CO APCD data to other data sources to investigate socio-economic factors on health. Through the geocoded socio-economic background score (GSB) CIVHC created, analysts can now overlay claims data with other data sets, such as the American Community Survey (ACS) and the Centers for Disease Control and Prevention (CDC) Social Vulnerability Index, to report on the intersection of social determinant of health factors such as income level, housing status, race and ethnicity, and health outcomes. In 2024, the Human Services Research Institute (HSRI) and CIVHC joint-released a white paper exploring how geocoding helps APCDs open the door to enhanced equity reporting titled Putting Health Care Data on the Map: Advancing Health Care Equity Through Enhanced Geographic Context in Health Care Administrative Datasets.
Health Equity Analytics in Public Reporting
CIVHC used these capabilities in a public report for the first time with the Health Equity Analysis, released in spring 2023. The innovative analysis investigates the relationship between key social factors – including education and income levels, race and ethnicity, employment status, and more – and the access and use of health care services measured on the Community Dashboard.
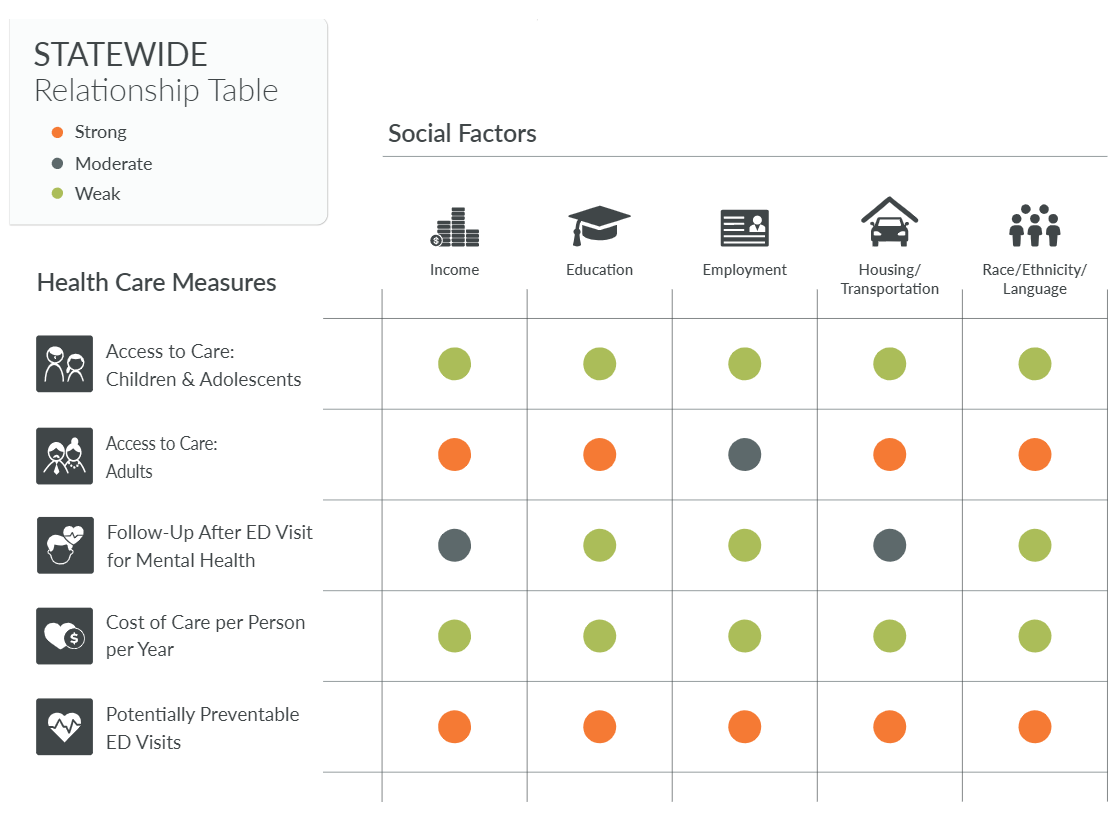
Socio-economic measures included in the report (income; education; employment status; housing and transportation; race, ethnicity and language) were derived from the ACS and the CDC Social Vulnerability Index, marking the first time outside data sources were incorporated into a CIVHC report and demonstrating the power of analysis provided by a geocoded CO APCD.
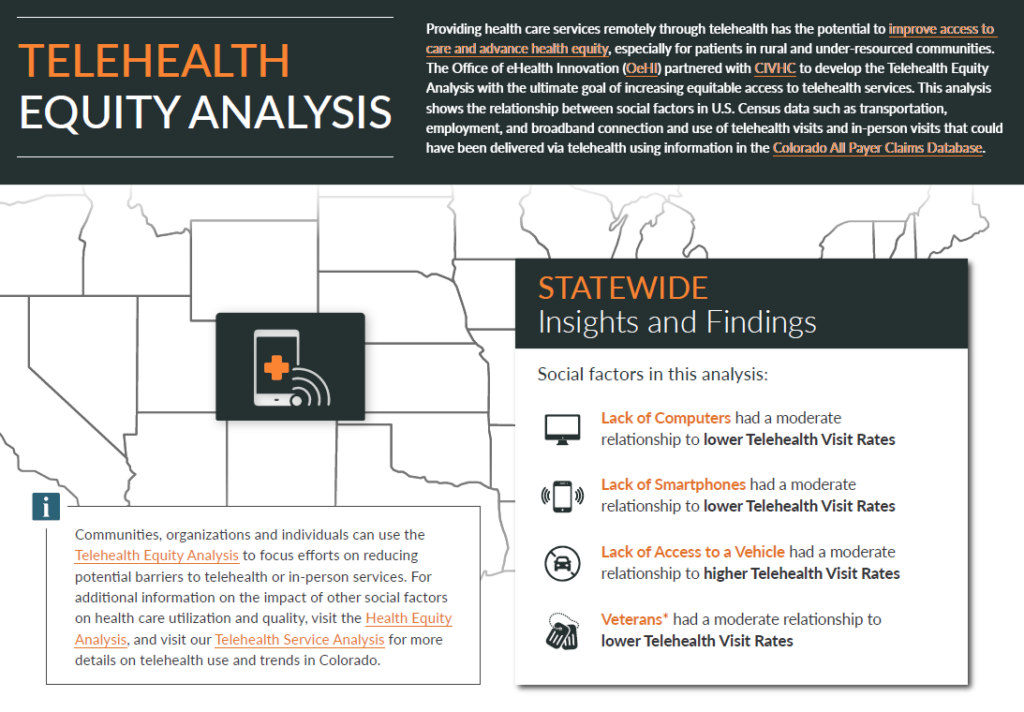
In early 2024, CIVHC released its second public report utilizing health equity analytics with the Telehealth Equity Analysis. Similar to the Health Equity Analysis, this report pairs CO APCD data with U.S. Census data to investigate the relationship between social determinants, such as transportation and internet connectivity, and telehealth usage at the neighborhood level to identify barriers to access.
CIVHC will continue to update the CO APCD geocoding each year and continue to work to identify opportunities to further integrate geocoded data into future reporting and analyses as appropriate. Through these innovative steps, the CO APCD continues to grow in exciting ways that allows it to stand out in its scope, comprehensibility, and utility.
For questions related to social determinant of health data and reporting, contact us at info@civhc.org.