Updated Data Now Available in Provider Payment Tool

The Center for Improving Value in Health Care (CIVHC) recently updated the Provider Payment Tool, the only health care transparency tool of its kind in Colorado. Based on legislation passed in 2022, the tool shows how payments made to doctors and other health care providers vary across the state.

Price transparency efforts like the Provider Payment Tool are essential to achieving a more affordable, equitable, and effective health care system. Increasing transparency around health care costs and pricing equips payers and providers with information to benchmark their own payments, while helping consumers and employers understand reasonable costs. Additionally, legislators, state agencies and researchers can use this information to better understand where payment variation exists in an effort to make health care more affordable.

While most publicly available transparency tools, including CIVHC’s Shop or Care tool, provide prices based on hospital and other facility-based payments, this tool identifies how much Colorado doctors and other providers get paid for specific services. The tool provides prices (payer and patient combined) for thousands of health care services (CPT and HCPS codes) and was developed using claims information in the Colorado All Payer Claims Database (CO APCD).

“This tool is one of kind, not only in Colorado, but across the nation,” said Kristin Paulson, CIVHC President and CEO. “Providers themselves have historically had very little understanding of how their payments compare to their peers. This tool unlocks that information for providers and a host of other potential users that can use the information to better understand health care prices across the state.”

The tool offers views into how payments vary and have changed over time depending on where the service took place, which insurance payer was involved, and the type of doctor who provided the service. For example, the tool shows that statewide, the typical price specialists and general doctors are paid for a 45-minute therapy session depends on insurance payer, and payments across all insurance payers have increased since 2018.

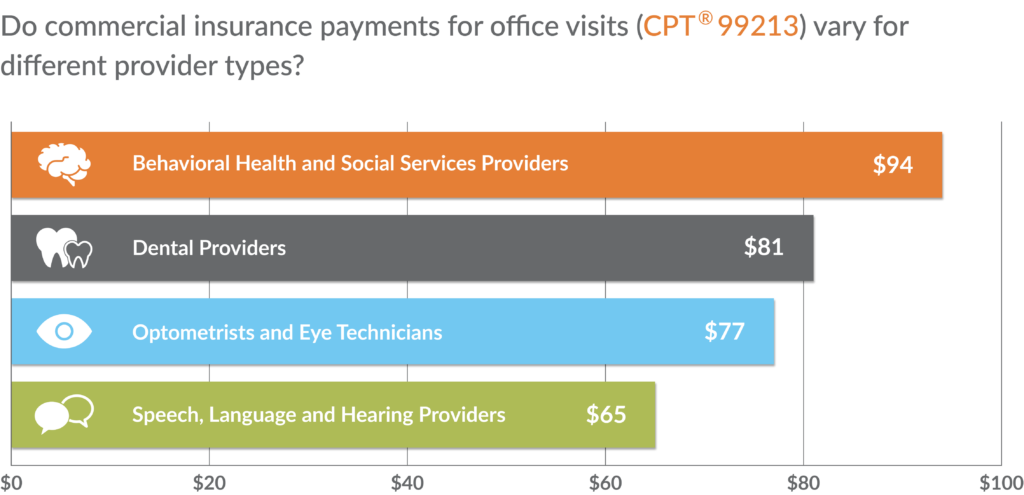
The tool also allows users to see how commercial payments for things like routine office visits differ depending on the type of provider (behavioral health provider, dentist, etc.).

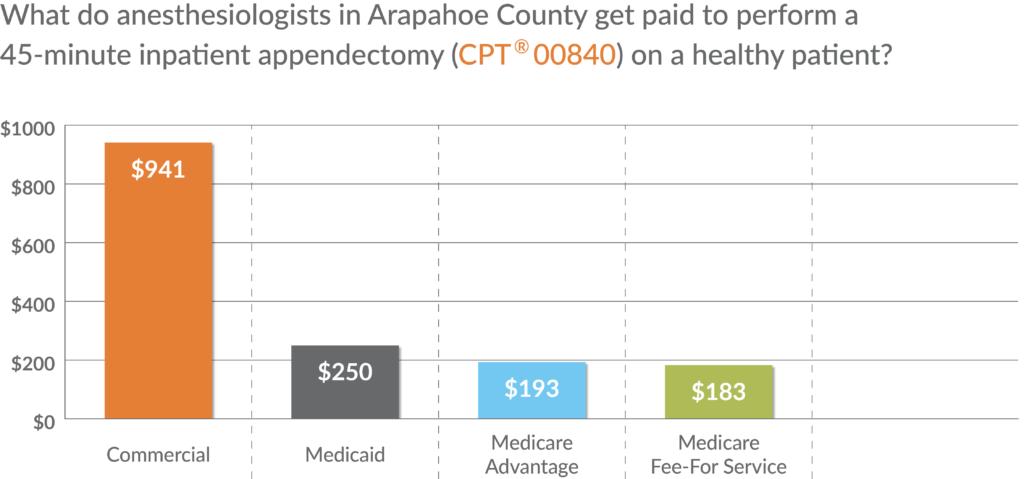
A separate calculator provides information about anesthesia payments based on several different factors that influence how these services are paid for. Using this tab, users can explore how anesthesia payments differ based on the procedure, where it was performed, type of provider, and the health status of the patient.

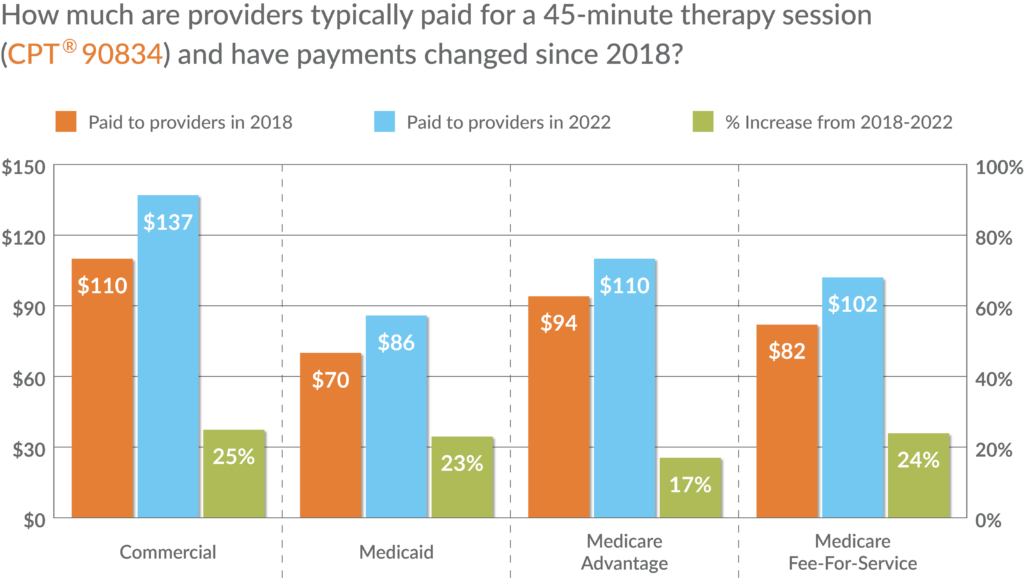
There is often a range of payments that occur for specific services, even for one specific payer type. To account for this variation, the tool provides average payments, as well as low, mid and high-end payments (25th, 50th, 60th and 75th percentiles). All current codes (effective in 2022) with sufficient volume (statewide claim volume of 30 or more) are included, and filters are available to address a number of variables that may impact payment results:

  • Years: 2018, 2019, 2020, 2021, and 2022
  • Payers: Commercial, Medicaid, Medicare Advantage, and Medicare Fee-for-Service
  • Setting: Hospital (inpatient) vs. non-hospital (outpatient)
  • Geography: Statewide, County, or Division of Insurance (DOI) rate setting region
  • Provider Type/Setting: Specialists and General Practitioners, Home Health and Nursing Home, etc.

Price transparency tools are key to understanding areas of opportunity to reduce health inequities and barriers to accessing affordable health care services. Other price transparency tools and reports from CIVHC include:

  • Shop for Care: Enables consumers, providers, and others to compare prices for select “shoppable” health care services and quality information on a named hospital and facility basis.
  • Out-of-Network Report: Created to support Colorado’s No Surprises Billing Act, the data provides allowed amounts for professional and emergency services based on in-network benchmarks. This data is used to determine maximum payments for out-of-network provider services.
Resources

For more information or additional questions, contact us at info@civhc.org .