The Community Dashboard, a tool designed to help communities, organizations, and individuals understand cost, quality and access to health care in Colorado, now includes additional years of data. Across all insurance payers in the Colorado All Payer Claims Database (CO APCD), statewide data shows that payments for health care services increased 27%. The most dramatic increases occurred in prescription drug (97% increase) and outpatient service payments (33% increase). The Community Dashboard is part of CIVHC’s new mission and renewed focus on providing community-level data and support to advance access to high quality, equitable, and affordable health care services.
Communities and others can use county-level data in the dashboard to understand and benchmark where spending is the highest, and how it is changing over time for patients and payers. Equipped with this information, Coloradans can make decisions about where to focus efforts, and track progress towards more affordable health care.
“CIVHC is proud to be able to provide this important information to support state, provider, and community-led efforts to expand access to care, and reduce costs and inequities across Colorado,” said Kristin Paulson, CIVHC President and CEO. “There are programs in Colorado already working to reduce prescription drug spending and implement other cost saving strategies from a systematic and policy perspective. With state and regional data from the CO APCD, communities can zero in on additional areas of focus to complement ongoing efforts and track progress across their population.”
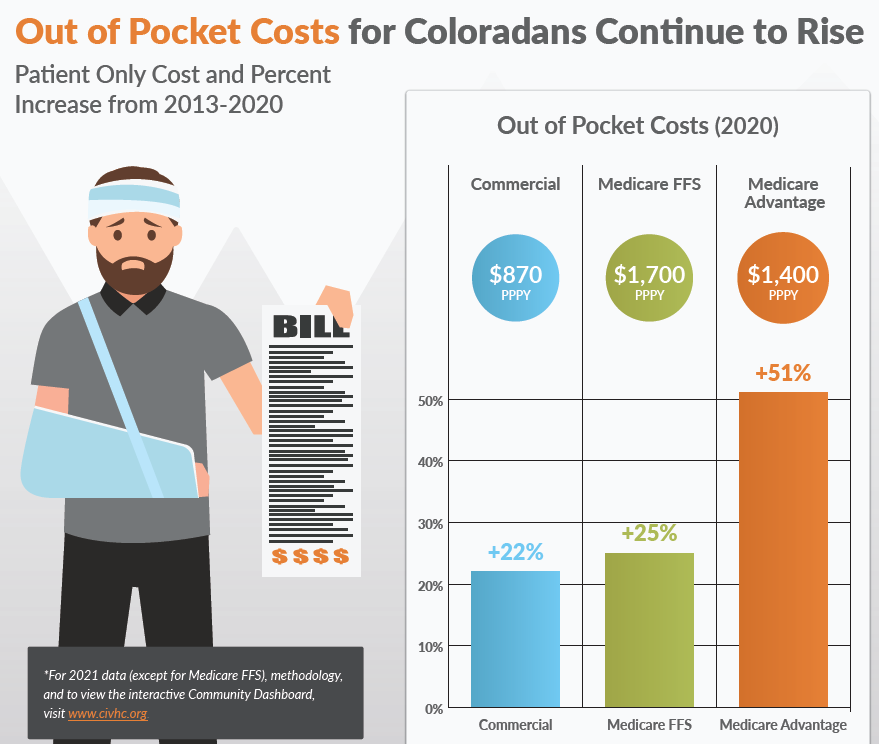
Across the state, out of pocket costs for Coloradans with commercial insurance rose significantly from 2013-2021. In 2021, Coloradans with commercial insurance paid a little over $1,000 per person to access health care services, a $300 per person jump over 2013 costs. These costs do not include health insurance premiums paid by Coloradans or their employers.
People with Medicare Advantage and Medicare Fee-for-Service also experienced large increases in out-of-pocket spending from 2013-2020. Those with Medicare Advantage paid $1,400 per person in 2020, a 51% increase over 2013 out-of-pocket costs. Medicare Fee-for-Service members experienced a 25% increase in out-of-pocket costs since 2013 with an average of $1,700 in annual personal expenses for services.
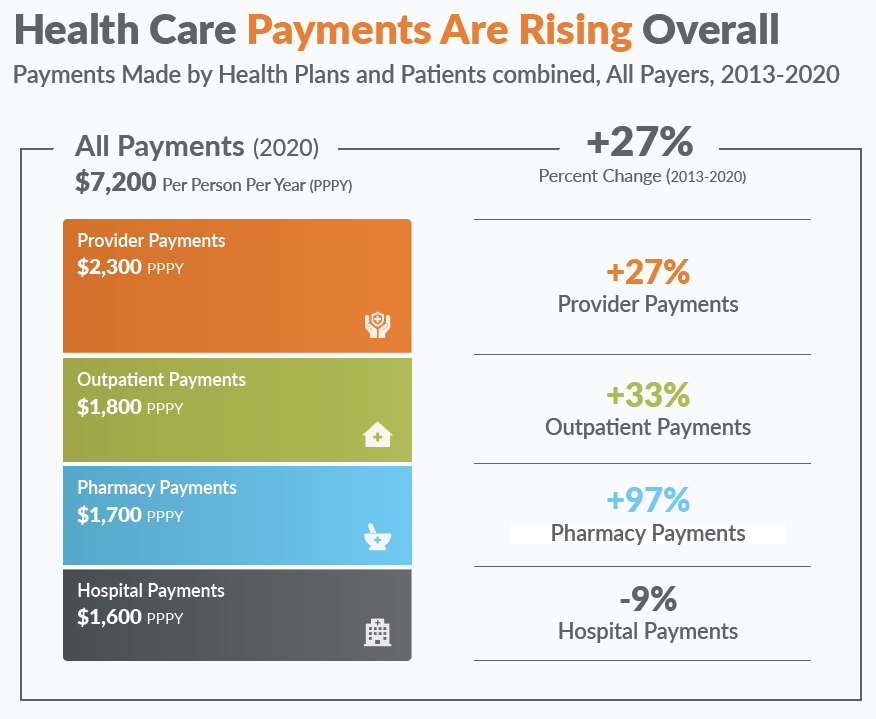 Across all payers and all categories in the CO APCD in 2020, payments made by health insurance payers and patients totaled $7,200 per person per year (PPPY). Digging deeper into spending by health care category shows that payments made directly to doctors and other providers for services was the largest portion of spending (31%), followed by payments for outpatient facilities (24%), prescription drugs (23%), and hospital stays (22%).
In addition to cost information, the Community Dashboard has data to help communities understand if people are using their health insurance and whether they are going to the right place for the right services. Data on potentially preventable Emergency Department visits, well-child visits, and care for people with diabetes are available as well as other measures that can help counties and regions identify areas to focus improvement efforts.
Improving the quality of care is a focus for many providers and health systems across the state and the Community Dashboard helps illustrate the positive trends:
- Cervical cancer screenings increased by 16% (2013-2021)
- Breast cancer screenings increased by 5% (2014-2021)
- Appropriate care for diabetes patients (annual HBA1c testing) increased by 8% (2013-2021)
CIVHC updates the Community Dashboard annually and seeks input from communities and other Change Agents during the development process. If you have a particular measure of interest for your work that is not currently available, please let us know at info@civhc.org, and we will evaluate including it in future dashboard iterations.
- View the Community Dashboard & Methodology
- Download Excel files with additional data breakouts by age and gender
- View the Annual Check-up Cost Edition Infographic