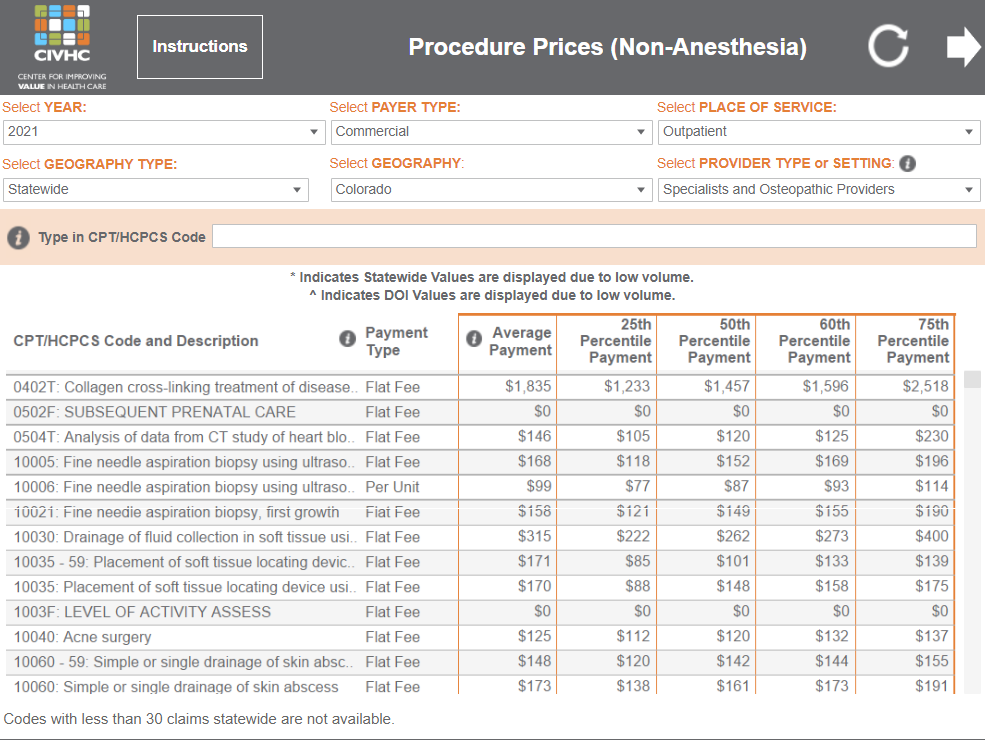
The Center for Improving Value in Health Care (CIVHC) recently released the Provider Payment Tool, the first health care transparency tool of its kind in Colorado. The tool, based on legislation passed in the 2022 session, shows how payments made to providers vary across the state.
While most other available data, including CIVHC’s Shop or Care tool, provide prices based on hospital and other facility fees and payments, this is the first comprehensive analysis identifying how much Colorado doctors and other providers get paid. The tool includes codes for thousands of services (CPT and HCPS codes) and was developed using claims information in the Colorado All Payer Claims Database (CO APCD).
How it Can Help
Accessing the free tool can help consumers, providers, payers and others understand how payments vary depending on where the service took place, which insurance payer was involved, and the type of doctor who provided the service. For example, the tool shows that statewide, the most common price doctors are paid for removing skin cancer from the facial region (CPT 11642) depends on whether the patient has Medicaid ($174), Medicare ($143), or commercial coverage ($236). It also allows users to see how commercial payments for office visits (CPT 99213) differ for dentists ($80), chiropractors ($71) and physician assistants ($96), and that those statewide payments may differ even more when you look at a specific county in Colorado.
The tool also includes a separate anesthesiology payment calculator that factors in a number of unique variables that go into determining payments for anesthesiologists and other anesthesia providers. For example, the tool shows that across the state, commercial payers pay anesthesiologists approximately $702 for a 45-minute hernia repair on a healthy patient, while a non-physician anesthetist under supervision gets paid half that amount ($351).
There is often a range of payments that occur for specific services, so the tool shows not only average payments, but the low, mid and high-end range of payments (25th, 50th, 60th and 75th percentiles). All current codes (effective in 2021) with sufficient volume (statewide claim volume of 30 or more) are included, and filters are available to address a number of variables that may impact the payment results:
- Year: 2018, 2019, 2020 and 2021
- Payer: Commercial, Medicaid, Medicare Advantage, and Medicare Fee-for-Service
- Setting: Hospital (inpatient) vs. non-hospital (outpatient)
- Geography: Statewide, County, or Division of Insurance (DOI) rate setting region
- Provider Type/Setting: Specialists and Osteopathic Providers, Home Health and Nursing Home, etc.
Price transparency efforts are essential in promoting a more efficient and effective health care system. This public data helps increase transparency and equips payers and providers with information to benchmark their own payments, while helping consumers and employers understand reasonable costs. Additionally, legislators, state agencies and researchers can benefit from this information by better understanding the drivers of payment variation and determining ways to make health care more affordable.
Other Price Transparency Tools and Reports:
- Shop for Care: A tool that enables consumers, providers and others to compare prices for select “shoppable” health care services and quality information on a named hospital and facility basis.
- Out-of-Network Report: Created to support Colorado’s No Surprise Billing Act, this report contains allowed amounts for professional and emergency services. It helps users determine payments for out-of-network provider services.
For more information or additional questions, contact us at info@civhc.org .